A week ago I was presenting at the Kaspersky Security Analyst Summit. My presentation was titled: “Creating Your Own Threat Intel Through Hunting & Visualization“.
Here are a couple of impressions from the conference:


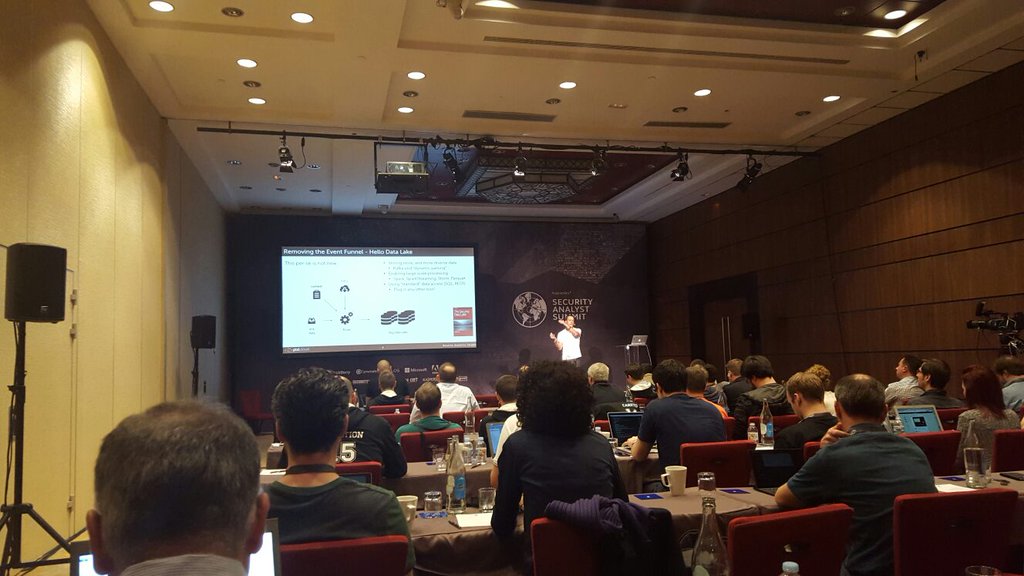
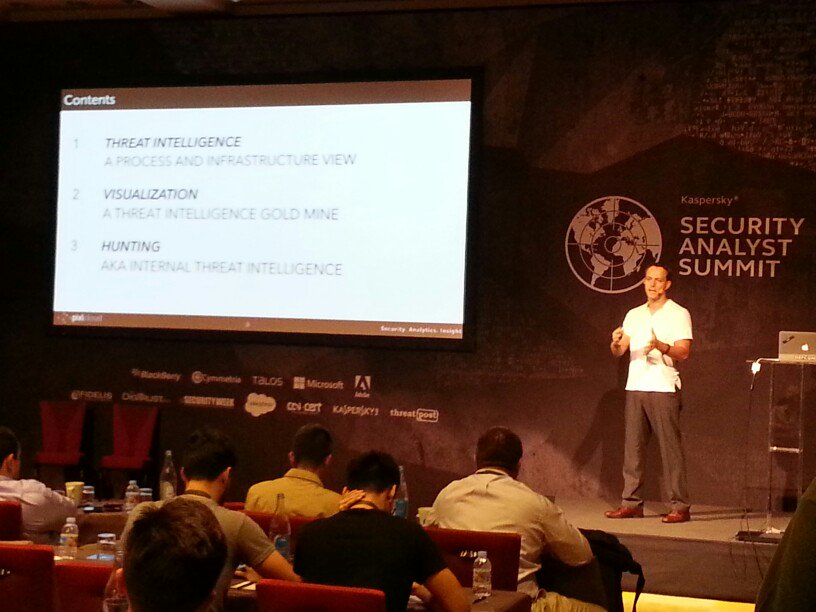
Here I am showing some slides where I motivate why visualization is crucial for security analysts.
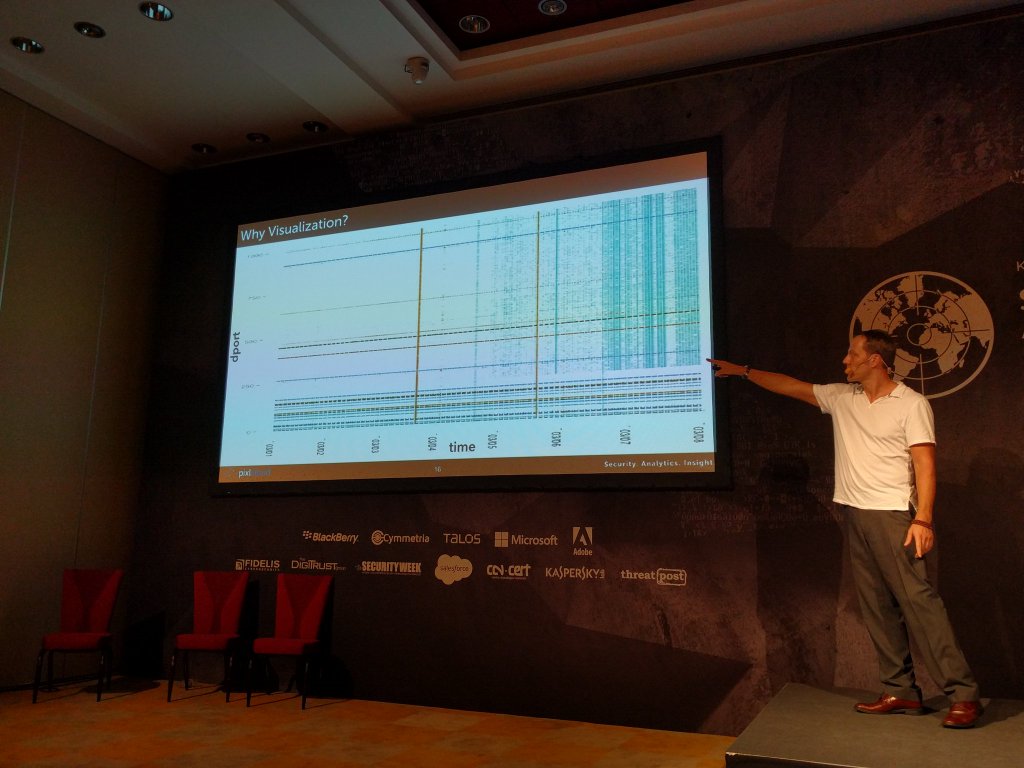
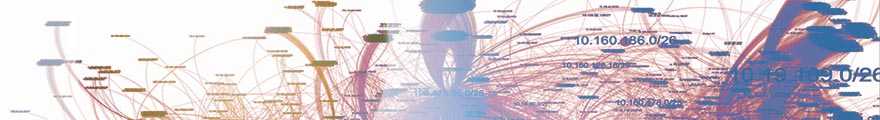
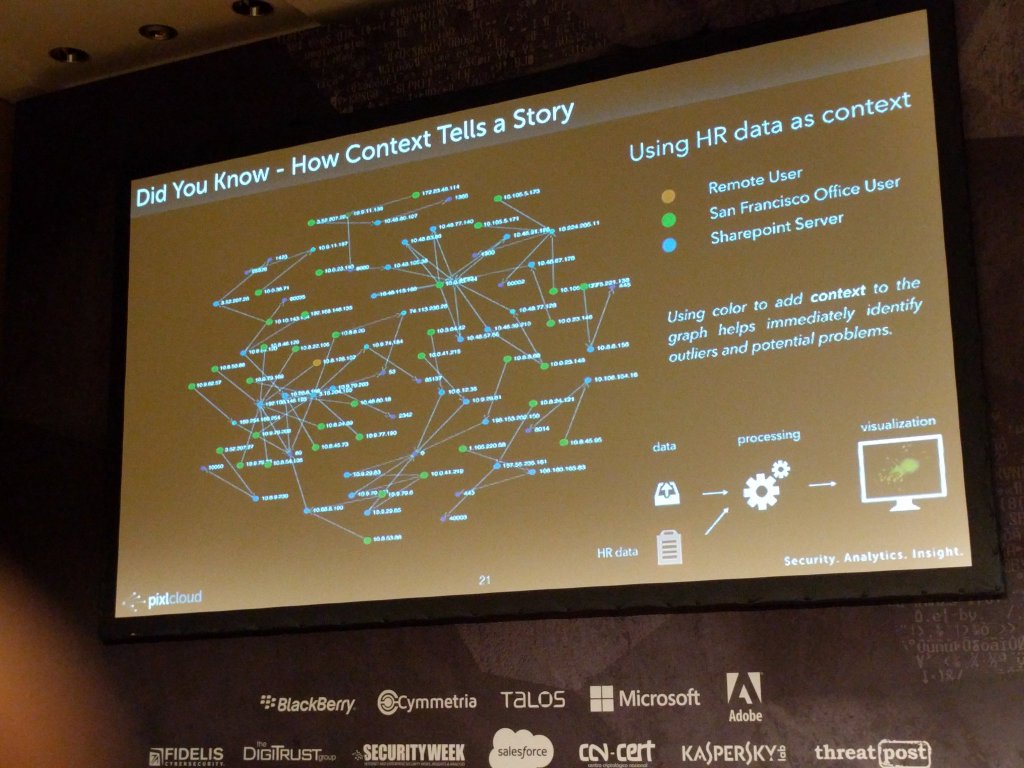
And a zoom in of the reason for why visualization is important. Note that emerging blue pattern towards the right of the scatter plot on the left. On the right you can see how context was used to augment the visualization to help identify outliers or interesting areas:

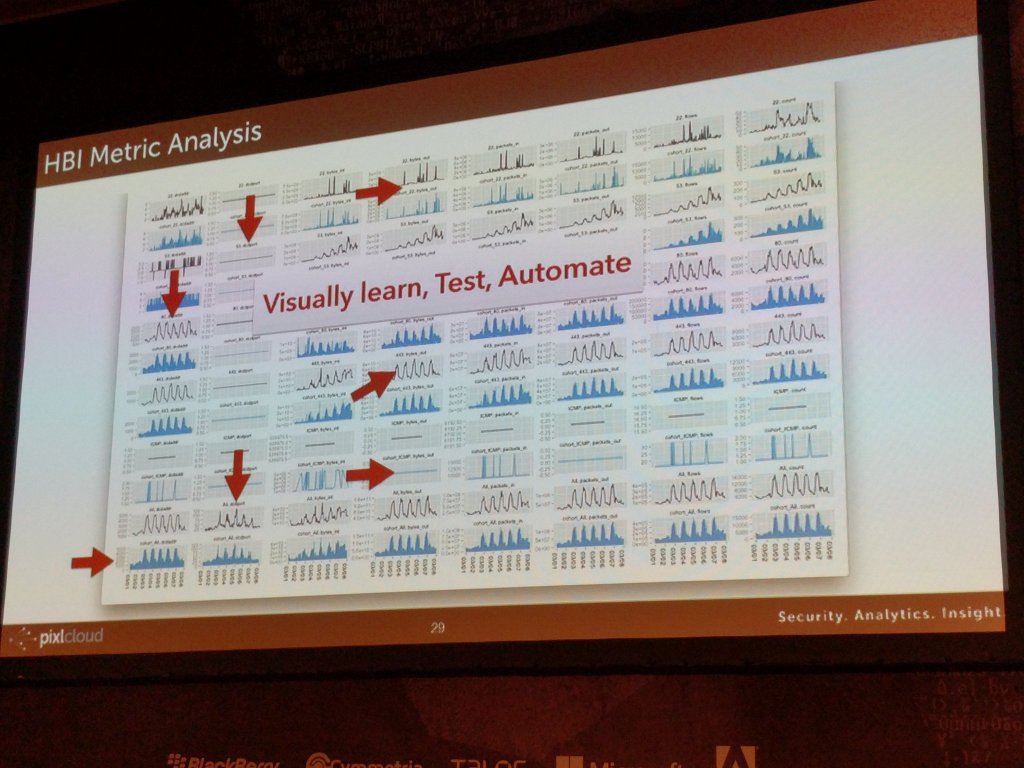
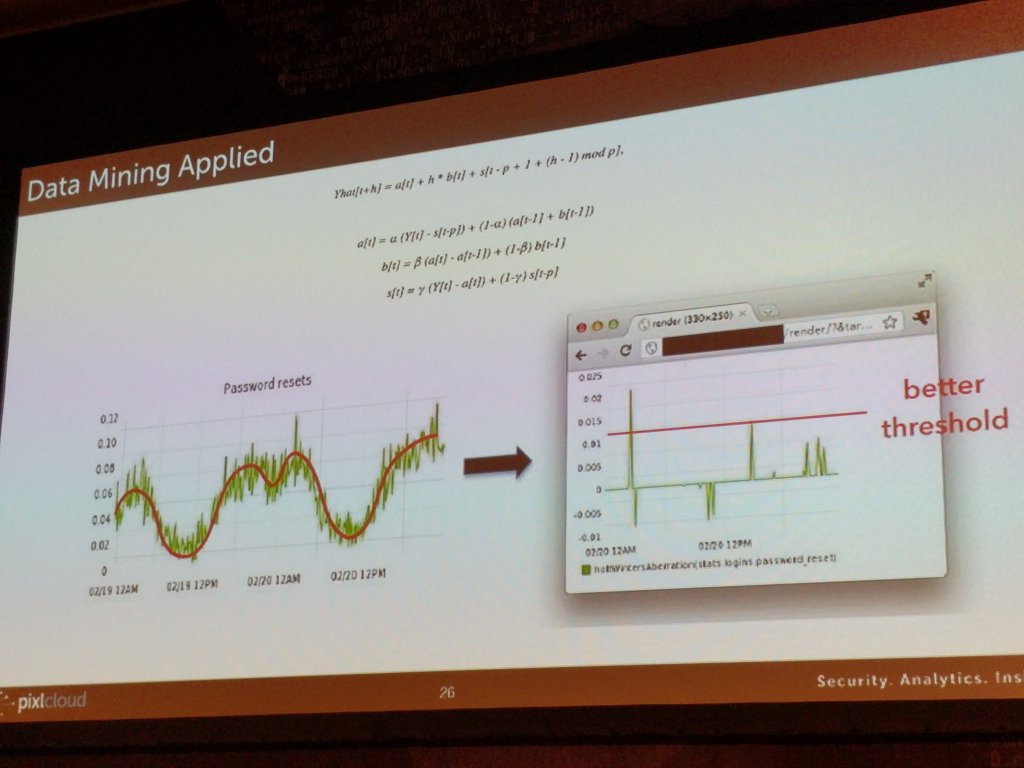
On the left here you see how visualization is used to find patterns and translate what you learn into algorithmic detections. On the right, I am showing a way to set thresholds on periodic data.