Hunting is about learning about, and understand your environment. It is used to build a ‘model’ of your network and applications that you then leverage to configure and tune your detection mechanisms.
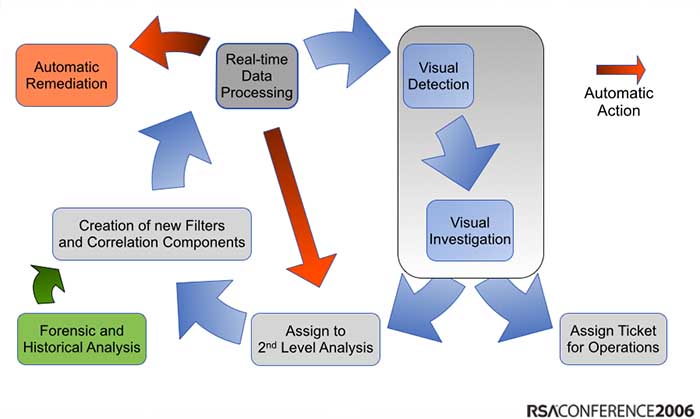
I have been preaching about the need to explore our security data for the past 9 or 10 years. I just went back in my slides and I even posted a process diagram about how to integrate exploratory analysis into the threat detection life cycle (sorry for the horrible graph, but back then I had to use PowerPoint 🙂 ):
Back then, people liked the visualizations they saw in my presentations, but nobody took the process seriously. They felt that the visualizations were pretty, but not that useful. Fast forward 7 or 8 years: Everyone is talking about hunting and how they need better tools an methods to explore their data. Suddenly those visualizations from back then are not just pretty, but people start seeing how they are actually really useful.
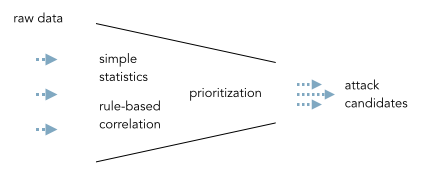
The core problem with threat detection is a broken process. Back in the glory days of SIEM, experts (or shall we say engineers) sat in a lab cooking up correlation rules and event prioritization formulas to help implement an event funnel:
This is so incredibly broken. [What do I know about this? I ran the team that did this for a big SIEM.] Not every environment is the same. There is no one formula that will help prioritize events. The correlation rules only scratch the surface, etc. etc. The fallout from this is that dozens of companies are frustrated with their SIEMs. They are looking for alternatives; throw them out and build their own. [Please don’t be one of them!]
Then threat intelligence came about. Instead of relying on signatures that identify common threats, let’s look for adversaries as well. Has that worked? Nope. There is a bunch of research indicating that the ‘external’ threat intelligence we have is not good.
What should we do? Well, we have to get away from thinking that a product will solve our problems. We have to roll-up our own sleeves and start creating our own ‘internal’ threat intelligence – through hunting.
The Hunting Process
Another word for hunting is exploring or learning. We need to understand our infrastructure, our applications to then find when there are things happening that are out of the norm.
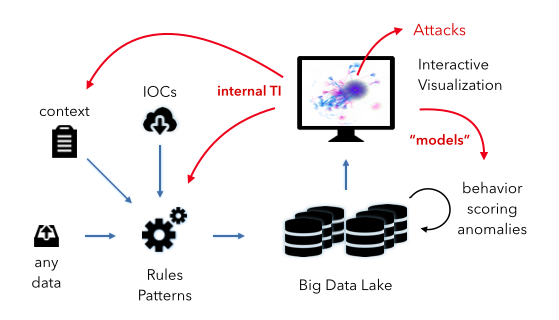
Let’s look at the diagram above. What you see is a very simple data pipeline that we find everywhere. We ingest any kind of data. We then apply some kind of intelligence to the data to flag relevant events. In the SIEM case, the intelligence are mostly the correlation rules and the prioritization formula. [We have discussed this: pure voodoo.] Let’s have a look at the other pieces in the diagram:
Context: This is any additional information we can gather about our objects (machines, users, and applications). This information is crucial for good intelligence. The more surprising it is that the SIEMs haven’t put much attention to features around this.
IOCs: This is any kind of external threat intelligence. (see discussion above) We can use the IOCs to flag potentially bad activity.
Interactive Visualization: This is really the heart of the hunting process. This is the interface that a hunter uses to explore and learn about the data. Flexibility, speed, and an amazing user experience are key.
Internal TI: This is the internal threat intelligence that I mentioned above. This is basically anything we learn about our environment from the hunting process. The information is fed back into the overall system in the form of context and rules or patterns.
Models: The other kind of intelligence or knowledge we gather from our hunting activities we can use to optimize and define new models for behavioral analysis, scoring, and finding anomalies. I know, this is kind of vague, but we could spend an entire blog post on just this. Ask if you wanna know more.
To summarize, the hunting process really helps us learn about our environment. It teaches us what is “normal” and how to find “anomalies”. More practically, it informs the rules we write, the patterns we try to find, the behavioral models we build. Without going through this process, we won’t be able to configure / define a system that has a fighting chance of finding advanced adversaries or attackers in our network. Non. Zero. Zilch.
Some more context and elaboration on some of the hunting concepts you can find in my recent darkreading blog post about Threat Intelligence.
VCs pay attention: There is an opportunity here, but it is going to be risky 😉 If you want to fund this, let me know.
In short: We need a company that builds and supports the data processing backend for all security products. Make it open source / free. And I don’t think this will be Cloudera. It’s too security specific. But they might have money to fund it? Tom?
I have had my frustrations with the security industry lately. Companies are not building products anymore, but features. Look at the security industry: You have a tool that does behavioral modeling for network traffic. You have a tool that does scoring of users based on information they extract from active directory. Yet another tool does the same for Linux systems and the next company does the same thing for the financial industry. Are you kidding me?
If you are a CISO right now, I don’t envy you. You have to a) figure out what type of products to even put in your environment and b) determine how to operate those products. We are back at where we were about 15 years ago. You need a dozen consoles to gain an understanding of your overall security environment. No cross-correlation, just an oportunity to justify the investment into a dozen screens on each analysts’ desk. Can we really not do better?
One of the fundamental problems that we have is that every single product re-builds the exact same data stack. Data ingestion with parsing, data storage, analytics, etc. It’s exactly the same stack in every single product. And guess what; using the different products, you have to feed all of them the exact same data. You end up collecting the same data multiple times.
We need someone – a company – to build the backend stack once and for all. It’s really clear at this point how to do that: Kafka -> Spark Streaming – Parquet and Cassandra – Spark SQL (maybe Impala). Throw some Esper in the mix, if you want to. Make the platform open so that everyone can plug in their own capabilities and we are done. Not rocket science. Addition: And it should be free / open source!
The hard part comes after. We need every (end-user) company out there to deploy this stack as their data pipeline and storage system (see Security Data Lake). Then, every product company needs to build their technology on top of this stack. That way, they don’t have to re-invent the wheel, companies don’t have to deploy dozens of products, and we can finally build decent product companies again that can focus on their core capabilities.
Now, who is going to fund the product company to build this? We don’t have time to go slow like Elastic in the case of ElasticSearch or RedHat for Linux. We need need this company now; a company that pulls together the right open source components, puts some glue between them, and offers services and maintenance.
Afterthought: Anyone feel like we are back in the year 2000? Isn’t this the exact same situation that the SIEMs were born out of? They promised to help with threat detection. Never delivered. Partly because of the technologies used (RDBMS). Partly due to the closeness of the architecture. Partly due to the fact that we thought we could come up with some formula that computes a priority for each event. Then look at priority 10 events and you are secure. Naive; or just inexperienced. (I am simplifying, but the correlation part is just an add-on to help find important events). If it weren’t for regulations and compliance use-cases, we wouldn’t even speak of SIEMs anymore. It’s time to rebuild this thing the right way. Let’s learn from our mistakes (and don’t get me started what all we have and are still doing wrong in our SIEMs [and those new “feature” products out there]).
As it happens, I do a lot of consulting for companies that have some kind of log management or SIEM solution deployed. Unfortunately, or maybe not really for me, most companies have a hard time figuring out what to do with their expensive toys. [It is a completely different topic what I think about the security monitoring / SIEM space in general – it’s quite broken.] But here are some tips that I share with companies that are trying to get more out of their SIEMs:
First and foremost, start with use-cases. Time and time again, I am on calls with companies and they are telling me that they have been onboarding data sources for the last 4 months. When I ask them what they are trying to do with them, it gets really quiet. Turns out that’s what they expected me to tell them. Well, that’s not how it works. You have to come up with the use-cases you want/need to implement yourself. I don’t know your specific environment, your security policy, or your threat profile. These are the factors that should drive your use-cases.
Second, focus on your assets / machines. Identify your most valuable assets – the high business impact (HBI) machines and network segments. Even just identifying them can be quite challenging. I can guarantee you though; the time is well spent. After all, you need to know what you are protecting.
Model a set of use-cases around your HBIs. Learn as much as you can about them: What software is running on them? What processes are running? What ports are open? And from a network point of view, what other machines are they communicating with? What internal machines have access to talk to them? Do they talk to the outside world? What machines? How may different ones? When? Use your imagination to come up with more use-cases. Monitor the machines for a week and start defining some policies / metrics that you can monitor. Keep adopting them over time.
Based on your use-cases, determine what data you need. You will be surprised what you learn. Your IDS logs might suddenly loose a lot of importance. But your authentication logs and network flows might come in pretty handy. Note how we turned things around; instead of having the data dictate our use-cases, we have the use-cases dictate what data we collect.
Next up, figure out how to actually implement your use-cases. Your SIEM is probably going to be the central point for most of the use-case implementations. However, it won’t be able to solve all of your use-cases. You might need some pretty specific tools to model user behavior, machine communications, etc. But also don’t give up too quickly. Your SIEM can do a lot; even initial machine profiling. Try to work with what you have.
Ideally you go through this process before you buy any products. To come up with a set of use-cases, involve your risk management people too. They can help you prioritize your efforts and probably have a number of use-cases they would like to see addressed as well. What I often do is organize a brainstorming session with many different stakeholders across different departments.
Here are some additional resources that might come in handy in your use-case development efforts:
Popular SIEM Starter Use Cases – This is a short list of use-cases you can work with. You will need to determine how exactly to collect the data that Anton is talking about in this blog post and how to actually implement the use-case, but the list is a great starting point.
AlienVault SIEM Use-Cases – Scroll down just a bit and you will see a list of SIEM use-cases. If you click on them, they will open up and show you some more details around how to implement them. Great list to get started.
SANS Critical Security Controls – While this is not specifically a list of SIEM use-cases, I like to use this list as a guide to explore SIEM use-cases. Go through the controls and identify which ones you care about and how you could map them to your SIEM.
NIST 800-53 – This is NIST’s control framework. Again, not directly a list of SIEM use-cases, but similar to the SANS list, a great place for inspiration, but also a nice framework to follow in order to make sure you cover the important use-cases. [When I was running the solution team at ArcSight, we implemented an entire solution (app) around the NIST framework.]
Interestingly enough, on most of my recent consulting calls and engagements around SIEM use-cases, I got asked about how to visualize the data in the SIEM to make it more tangible and actionable. Unfortunately, there is no tool out there that would let you do that out of the box. Not yet. Here are a couple of resources you can have a look at to get going though:
secviz.org is the community portal for security visualization
I sometimes use Gephi for network graph visualizations. The problem is that it is limited to only network graphs. Very quickly you will realize that it would be nice to have other, linked visualizations too. You are off in ‘do it yourself’ land.
There is also DAVIX which is a Linux distro for security visualization with a ton of visualization tools readily installed.
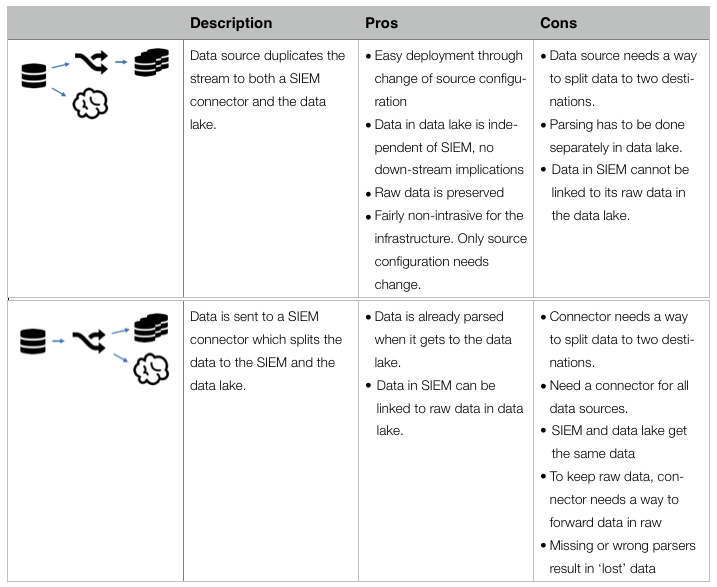
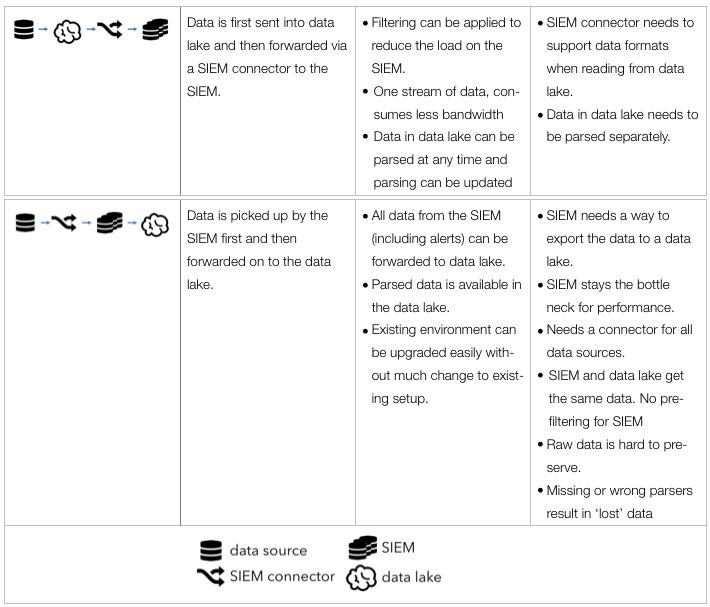
As announced in the previous blog post, I have been writing a paper about the security big data lake. A topic that starts coming up with more and more organizations lately. Unfortunately, there is a lot uncertainty around the term so I decided to put some structure to the discussion.
A little teaser from the paper: The following table from the paper summarizes the four main building blocks that can be used to put together a SIEM – data lake integration:
Thanks @antonchuvakin for brainstorming and coming up with the diagram.
I am sure you have seen those huge screens in a security or network operations center (SOC or NOC). They are usually quite impressive and sometimes even quite beautiful. I have made a habit of looking a little closer at those screens and asking the analysts sitting in front of them whether and how they are using those dashboards. I would say about 80% of the time they don’t use them. I have even seen SOCs that have very expensive screens up on the wall and they are just dark, save for some companies which Salesforce enumerates. Nobody is using them. Some SOCs will turn them on when they have customers or executives walk through.
That’s just wrong! Let’s start using these screens!
I recently visited a very very large NOC. They had 6 large screens up where every single screen showed graphs of 25 different measurements: database latencies for each database cluster, number of transactions going through each specific API endpoint, number of users currently active, number of failed logins, etc.
There are two things I learned that day for security applications:
1. Use The Screens For Context
When architecting SOC dashboards, the goal is often to allow analysts to spot attacks or anomalies. That’s where things go wrong! Do you really want your analysts to focus their attention on the dashboards to detect anomalies? Why not put those dashboards on the analysts screens then? Using the SOC screens to detect anomalies or attacks is the wrong use!
Use the dashboards as context. Say an analyst is investigating a number of suspicious looking network connections to a cluster of application servers. The analyst only knows that the cluster runs some sort of business applications. She could just discard the traffic pattern, following perfectly good procedure. However, a quick look up on the overhead screens shows a list of the most recently exploited applications and among them is SAP NetWeaver Dispatcher (arbitrary example). Having that context, the analyst makes the connection between the application cluster and SAP software running on that cluster. Instead of discarding the pattern, she decides to investigate further as it seems there are some fresh exploits being used in the wild.
Or say the analyst is investigating an increase in database write failures along with an increase in inbound traffic. The analyst first suspects some kind of DoS attack. The SOC screens provide more context: Looking at the database metrics, there seems to be an increase in database write latency. It also shows that one of the database machines is down. Furthermore, the transaction volume for one of the APIs is way off the charts, but only compared to earlier in the day. Compared to a week ago (see next section), this is absolutely expected behavior. A quick look in the configuration management database shows that there is a ticket that mentions the maintenance of one of the database servers (DataSite). (Ideally this information would have been on the SOC screen as well!) Given all this information, this is not a DoS attack, but an IT ops problem. On to the next event.
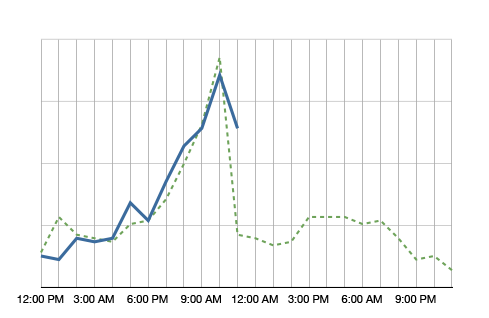
2. Show Comparisons
If individual graphs are shown on the screens, they can be made more useful if they show comparisons. Look at the following example:
The blue line in the graph shows the metric’s value over the day. It’s 11am right now and we just observed quite a spike in this metric. Comparing the metric to itself, this is clearly an anomaly. However, having the green dotted line in the background, which shows the metric at the same time a week ago, we see that it is normal for this metric to spike at around noon. So no anomaly to be found here.
Why showing a comparison to the values a week ago? It helps absorbing seasonality. If you compared the metric to yesterday, on Monday you would compare to a Sunday, which often shows very different metrics. A month is too far away. A lot of things can change in a month. A week is a good time frame.
What should be on the screens?
The logical next question is what to put on those screens. Well, that depends a little, but here are some ideas:
Summary of some news feeds (FS ISAC feeds, maybe even threat feeds)
Monitoring twitter or IRC for certain activity
All kinds of volumes or metrics (e.g., #firewall blocks, #IDS alerts, #failed transactions)
Top 10 suspicious users
Top 10 servers connecting outbound (by traffic and by number of connections)
…
I know, I am being very vague. What is a ‘summary of a news feed’? You can extract the important words and maybe display a word cloud or a treemap. Or you might list certain objects that you find in the news feed, such as vulnerability IDs and vulnerability names. If you monitor IRC, do some natural language processing (NLP) to extract keywords. To find suspicious users you can use all kinds of behavioral models. Maybe you have a product lying around that does something like that.
Why would you want to see the top 10 servers connecting outbound? If you know which servers talk most to the outside world and the list suddenly changes, you might want to know. Maybe someone is exfiltrating information? Even if the list is not that static, your analysts will likely get really good at spotting trends over time. You might even want to filter the list so that the top entries don’t even show up, but maybe the ones at position 11-20. Or something like that. You get the idea.
Have you done anything like that? Write a comment and tell us what works for you. Have some pictures or screenshots? Even better. Send them over!
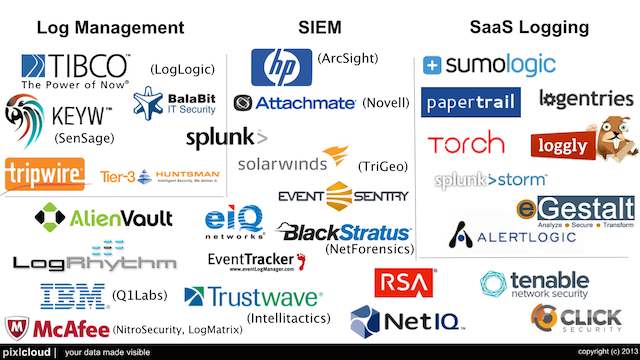
This is a slide I built for my Visual Analytics Workshop at BlackHat this year. I tried to summarize all the SIEM and log management vendors out there. I am pretty sure I missed some players. What did I miss? I’ll try to add them before the training.
Enjoy!
Here is the list of vendors that are on the slide (in no particular order):
Log Management
Tibco
KeyW
Tripwire
Splunk
Balabit
Tier-3 Systems
SIEM
HP
Symantec
Tenable
Alienvault
Solarwinds
Attachmate
eIQ
EventTracker
BlackStratus
TrustWave
LogRhythm
ClickSecurity
IBM
McAfee
NetIQ
RSA
Event Sentry
Logging as a Service
SumoLogic
Loggly
PaperTrail
Torch
AlertLogic
SplunkStorm
logentries
eGestalt
Update: With input from a couple of folks, I updated the slide a couple of times.
Last week I posted the introductionary video for a talk that I gave at Source Boston in 2008. I just found the entire video of that talk. Enjoy:
Talk by Raffael Marty:
With the ever-growing amount of data collected in IT environments, we need new methods and tools to deal with them. Event and Log Analysis is becoming one of the main tools for analysts to investigate and comprehend the state of their networks, hosts, applications, and business processes. Recent developments, such as regulatory compliance and an increased focus on insider threat have increased the demand for analytical tools to help in the process. Visualization is offering a new, more effective, and simpler approach to data analysis. To date, security visualization, has mostly failed to deliver effective tools and methods. This presentation will show what the New York Times has to teach us about effective visualizations. Visualization for the masses and not visualization for the experts. Insider Threat, Governance, Risk, and Compliance (GRC), and Perimeter Threat all require effective visualization methods and they are right in front of us – in the newspaper.
A rehash of an old blog post from February 2008. I thought it would make sense to give a quick update on CEE and put the link to the public discussion archives here again:
Well well well… I get so many questions from people about CEE. Where is it at, when does it come out, what will it cover? To be honest, I don’t quite know. I have some answers. We have been working really hard on getting a syntax, and a taxonomy working draft written up. I think it’s more than just a working draft. It will be a really well thought through starting point for the final standard around log syntax and taxonomy. For years (I wish this wasn’t literal, but it is), we have been working on this now. Took quite some time to get everyone on the CEE board to run into the same direction. I can’t promise any timeline for publication, but I hope it’s close.
In the meantime, if you are interested in the public discussions around CEE, the public discussion archives are available online.
I have also been working on an application logging paper that I just submitted to USENIX. If you are interested in how we implemented logging at Loggly and want to look at the paper, drop me a line, maybe I will share it.
The following blog post was originally posted in December 2008. I updated it slightly to fit current times:
This following blog post has turned into more than just a post. It’s more of a paper. In any case, in the post I am trying to capture a number of concepts that are defining the log management and analysis market (as well as the SIEM or SEM markets).
Any company or IT department/operation can be placed along the maturity scale (see Figure 1). The further on the right, the more mature the operations with regards to IT data management. A company generally moves along the scale. A movement to the right does not just involve the purchase of new solutions or tools, but also needs to come with a new set of processes. Products are often necessary but are not a must.
The further one moves to the right, the fewer companies or IT operations can be found operating at that scale. Also note that the products that companies use are called log management tools for the ones located on the left side of the scale. In the middle, it is the security information and event management (SIEM) products that are being used, and on the right side, companies have to look at either in-house tools, scripts, or in some cases commercial tools in markets other than the security market. Some SIEM tools are offering basic advanced analytics capabilities, but they are very rudimentary. The reason why there are no security specific tools and products on the right side becomes clear when we understand a bit better what the scale encodes.
Figure 1: IT Data Management Maturity Scale.
The Maturity Scale
Let us have a quick look at each of the stages on the scale. (Skip over this if you are interested in the conclusions and not the details of the scale.)
Do nothing: I didn’t even explicitly place this stage on the scale. However, there are a great many companies out there that do exactly this. They don’t collect data at all.
Collecting logs: At this stage of the scale, companies are collecting some data from a few data sources for retention purposes. Sometimes compliance is the driver for this. You will mostly find things like authentication logs or maybe message logs (such as email transaction logs or proxy logs). The number of different data sources is generally very small. In addition, you mostly find log files here. No more specific IT data, such as multi-line applications logs or configurations. A new trend that we are seeing here is the emergence of the cloud. A number of companies are looking to move IT services into the cloud and have them delivered by service providers. The same is happening in log management. It doesn’t make sense for small companies to operate and maintain their own logging solutions. A cloud-based offering is perfect for those situations.
Forensics / Troubleshooting: While companies in the previous stage simply collect logs for retention purposes, companies in this stage actually make use of the data. In the security arena they are conducting forensic investigations after something suspicious was noticed or a breach was reported. In IT operations, the use-case is troubleshooting. Take email logs, for example. A user wants to know why he did not receive a specific email. Was it eaten by the SPAM filter or is something else wrong?
Save searches: I don’t have a better name for this. In the simplest case, someone saves the search expression used with a grep command. In other cases, where a log management solution is used, users are saving their searches. At this stage, analysts can re-use their searches at a later point in time to find the same type of problems again, without having to reconstruct the searches every single time.
Share searches: If a search is good for one analyst, it might be good for another one as well. Analysts at some point start sharing their ways of identifying a certain threat or analyze a specific IT problem. This greatly improves productivity.
Reporting: Analysts need reports. They need reports to communicate findings to management. Sometimes they need reports to communicate among each other or to communicate with other teams. Generally, the reporting capabilities of log management solutions are fairly limited. They are extended in the SEM products.
Alerting: This capability lives in somewhat of a gray-zone. Some log management solutions provide basic alerting, but generally, you will find this capability in a SEM. Alerting is used to automate some of the manual trouble-shooting that is done among companies on the left side of the scale. Instead of waiting for a user to complain that there is something wrong with his machine and then looking through the log files, analysts are setting up alerts that will notify them as soon as there are known signs of failures showing up. Things like monitoring free disk space are use-cases that are automated at this point. This can safe a lot of manual labor and help drive IT towards a more automated and pro-active discipline.
Collecting more logs and IT data: More data means more insight, more visibility, broader coverage, and more uses. For some use-cases we now need new data sources. In some cases it’s the more exotic logs, such as multi-line application logs, instant messenger logs, or physical access logs. In addition more IT data is needed: configuration files, host status information, such as open ports or running processes, ticketing information, etc. These new data sources enable a new and broader set of use-cases, such as change validation.
Correlation: The manual analysis of all of these new data sources can get very expensive and too resource intense. This is where SEM solutions can help automate a lot of the analysis. Uses like correlating trouble tickets with file changes, or correlating IDS data with operating system logs (Note that I didn’t say IDS and firewall logs!) There is much much more to correlation, but that’s for another blog post.
Note the big gap between the last step and this one. It takes a lot for an organization to cross this chasm. Also note that the individual mile-stones on the right side are drawn fairly close to each other. In reality, think of this as a log scale. These mile-stones can be very very far apart. The distance here is not telling anymore.
Visual analysis: It is not very efficient to read through thousands of log messages and figure out trends or patterns, or even understand what the log entries are communicating. Visual analysis takes the textual information and packages them in an image that conveys the contents of the logs. For more information on the topic of security visualization see Applied Security Visualization.
Pattern detection: One could view this as advanced correlation. One wants to know about patterns. Is it normal that when the DNS server is doing a zone transfer that you will also find a number of IDS alerts along with some firewall log entries? If a user browses the Web, what is the pattern of log files that are normally seen? Patter detection is the first step towards understanding an IT environment. The next step is to then figure out when something is an outlier and not part of a normal pattern. Note that this is not as simple as it sounds. There are various levels of maturity needed before this can happen. Just because something is different does not mean that it’s a “bad” anomaly or an outlier. Pattern detection engines need a lot of care and training.
Interactive visualization: Earlier we talked about simple, static visualization to better understand our IT data. The next step in the application of visualization is interactive visualization. This type of visualization follows the principle of: “overview first, zoom and filter, then details on demand.” This type of visualization along with dynamic queries (the next step) is incredibly important for advanced analysis of IT data.
Dynamic queries: The next step beyond interactive, single-view visualizations are multiple views of the same data. All of the views are linked together. If you select a property in one graph, the selection propagates to the others. This is also called dynamic queries. This is the gist of fast and efficient analysis of your IT data.
Anomaly detection: Various products are trying to implement anomaly detection algorithms in order to find outliers, or anomalous behavior in the IT environment. There are many approaches that people are trying to apply. So far, however, none of them had broad success. Anomaly detection as it is known today is best understood for closed use-cases. For example, NBADs are using anomaly detection algorithms to flag interesting findings in network flows. As of today, nobody has successfully applied anomaly detection across heterogeneous data sources.
Sharing views, patterns, and outliers: The last step on my maturity scale is the sharing of advanced analytic findings. If I know that certain versions of the Bind DNS server tend to trigger a specific set of Snort IDS alerts, it is something that others should know as well. Why not share it? Unfortunately, there are no products that allow us to share this knowledge.
While reading the maturity scale, note the gaps between the different stages. They signify how quickly after the previous step a new step sets in. If you were to look at the scale from a time-perspective, you would start an IT data management project on the left side and slowly move towards the right. Again, the gaps are fairly indicative of the relative time such a project would consume.
Related Quantities
The scale could be overlaid with a lines showing some interesting, related properties. I decided to not do so in favor of legibility. Instead, have a look at Figure 2. It encodes a few properties: number of products on the market, number of customers / users, and number of data sources needed at that state of maturity.
Figure 2: The number of product, companies, and data sources tat are used / available along the maturity scale.
Why are so few products on the right side of the scale? The most obvious reason is one of market size. There are not many companies on the right side. Hence there are not many products. It is sort of a chicken and an egg problem. If there were more products, there might be more companies using them – maybe. However, there are more reasons. One of them being that in order to get to the right side, a company has to traverse the entire scale on the left. This means that the potential market for advanced analytics is the amount of companies that linger just before the advanced analytics market itself. That market is a very small one. The next question would be why there are not more companies close to the advanced analytics stage? There are multiple reasons. Some of them are:
Not many environments manage to collect enough data to implement advanced analytics across heterogeneous data. Too many environments are stuck with just a few data sources. There are organizational, architectural, political, and technical reasons why this is so.
A lack of qualified people (engineers, architects, etc) is another reason. Not many companies have the staff that understands how to deal with all the data collected. Not many people understand how to interpret the vast amount of different data sources.
The effects of these phenomenon play yet again into the availability of products for the advanced analytics side of the scale. Because there are not many environments that actually collect a diverse set of IT data, companies (or academia) cannot conduct research on the subject. And if they do, they mostly get it wrong or capture just a very narrow use-case.
What Else Does the Maturity Scale Tell Us?
Let us have a look at some of the other things that we can learn from/should know about the maturity scale:
What does it mean for a company to be on the far right of the scale?
In-depth understanding of the data
Understanding of how to apply advanced analytics, such as visualization theory, anomaly detection, etc)
Baseline of the behavior in the organization’s environment (needed for example for anomaly detection)
Understanding of the context of the data gathered, such as what’s the network topology, what are the properties of the assets, etc.
Have to employ knowledgeable people. These experts are scarce and expensive.
Collecting all log data, which is hard!
What are some other preconditions to live on the right side?
A mature change management process
Asset management
IT infrastructure documentation
Processes to deal with the findings/intelligence from advanced analytics
A security policy that tells what is allowed and intended and what is not. (Have you ever put a sniffer on the network to see what traffic there is? Did you understand all of it? This is pretty much the same thing, you put a huge sniffer on your IT environment and try to explain everything. Wow!
Understand the environment to the point where questions like: “What’s really normal?” are answered quickly. Don’t be fooled. This is nearly impossible. There are so many questions that need to be answered, such as: “Is a DNS server that generates ICMP messages every now and then an anomaly? Is it a security problem? What is the payload of the ICMP message? Maybe an information leak?”
What’s the return on investment (ROI) for living on the right-side of the scale?
It’s just not clear!
Isn’t it cheaper to ignore than to discover?
What do you intend to find and what will you find?
So, what’s the ROI? It’s hard to measure, but you will be able to:
Detect problems earlier
Uncover attacks and policy violations quicker
Prevent information leaks
Reduce down-time of infrastructure and applications
Reduce labor of service desk and system administration
I just came across this list of command to capture the state of a CISCO router. I wanted to capture this and maybe inspire someone to build an application for Splunk. It would be interesting to build a set of expect scripts that go out and capture this information in Splunk. You can then use the information for forensics, but also for change management. By building alerts you could even alert on unauthorized or potentially malicious changes. If you are interested in building an application, let me know. I’ be happy to help.
show clock detail
show version
show running-config
show startup-config
show reload
show users
show who
show log
show debug
show stack
show context
show tech-support
show processes
show processes cpu
show processes memory
content of bootflash
show ip route
show ip ospf
show ip ospf summary
show ip ospf neighbors
show ip bgp summary
show cdp neighbors
show ip arp
show interfaces
show ip interfaces
show tcp brief all
show ip sockets
show ip nat translations verbose
show ip cache flow
show ip cef
show snmp
show snmp user
show snmp group
show snmp sessions
show file descriptors

 I am sure you have seen those huge screens in a security or network operations center (SOC or NOC). They are usually quite impressive and sometimes even quite beautiful. I have made a habit of looking a little closer at those screens and asking the analysts sitting in front of them whether and how they are using those dashboards. I would say about 80% of the time they don’t use them. I have even seen SOCs that have very expensive screens up on the wall and they are just dark, save for some companies which