
A new version of AfterGlow is ready. Version 1.6.5 has a couple of improvements:
1. If you have an input file which only has two columns, AfterGlow now automatically switches to a two-node mode. You don’t have to use the (-t) switch explicitly anymore in this case! (I know, it’s about time I added this)
2. Very minor change, but something that kept annoying me over time is the default edge length. It was set to 3 initially and now it’s reduced to 1.5, which makes fro a bit more compact graphs. You can still change this with the -e switch on the command line
3. The major change is about adding edge label though. Here is a quick example:
label.edge=$fields[2]
This assumes that the third column of your data contains the label for the data. In the example below, the port numbers:
10.0.0.5,10.0.0.1,53
10.0.0.5,10.0.0.1,80
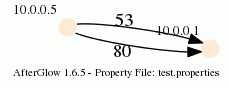
When you run afterglow, use the -t switch to have it render only two nodes, but given the configuration above, we are using the third column as the edge label. The output will look like this:

As you can see, we have twice the same edge defined in the data with two different labels (port 53 and 80). If you want to have the graph show both edges, you add the following configuration in the configuration file:
label.duplicate=1
Which then results in the following graph:
Note that the duplicating of edges only works with GDF files (-k). The edge labels work in DOT and GDF files, not in GraphSON output.