Update: Instead of an Excel spreadsheet, here is an online app that you can use. I’d love for you to submit your own ratings so we can crowd-source some of these answers!
“Ok, but how do I evaluate vendors consistently without falling back into feature checklists and marketing claims?”
So I turned the framework into a practical scoring workbook (and now a small Web application) you can use to rate a platform across the dimensions I described in the post. The workbook allows you to rate each category from 1 to 5 and I spent some time defining what a 1 versus a 5 means in each of the categories. I give you an example for the “Data Pipeline Optimization” category. Here are the 5 maturity steps:
1 | Static ingestion pipelines that forward all data to a central store.
2 | Basic filtering or routing based on source or log type.
3 | Conditional enrichment and routing based on use case or predefined alerts/rules.
4 | Dynamic pipelines that adapt sampling, enrichment, and routing based on downstream value.
5 | Continuously optimized pipelines driven by feedback loops from detections, cost, and analyst outcomes.
I hope the breakdown into these 5 values helps going through a more ‘objective’ assessment of these platforms and also shows what excellent looks like in each of these categories.
What this is
The Security Analytics Platforms – Maturity Framework is an architecture-first tool to evaluate security platforms across architectural, detection, and operational dimensions. It is designed to help you compare systems based on their advanced capabilities that are desperately needed to deliver a SIEM experience that is adequate for 2026..
What this is not
This is not a vendor ranking, a feature checklist, or a replacement for hands-on testing. It’s also NOT an RFP template. As I indicated in my previous blog where I outlined all the different categories, the table stakes are not mentioned or evaluated.
How to use it in 10 minutes
Add one vendor per row in the rating sheet.
Score each topic based on current behavior, not roadmap promises.
Review category roll-ups and the heatmap to spot structural gaps.
A key insight: large gaps between category scores often matter more than the overall score.
Security analytics is in the middle of a reset. Incumbent SIEMs are being re-architected, new SIEM startups are emerging, and AI SOC vendors are rewriting parts of the operating model. End users and investors need a way to evaluate these platforms objectively, beyond feature checklists and marketing claims. This workbook is my attempt to make that evaluation repeatable, comparable, and anchored in the areas that I see missing or deficient in the incumbent SIEM space.
If you use it, I’d love your feedback
If you score a platform with it, use the Web app and submit your rating. You need to log in via Github or Google so I don’t get flooded with fake entries. I’d love to crowdsource an assessment of all the SIEM and AI SOC vendors out there. Can we do it?
Security has always moved in waves. Not because we suddenly get smarter, but because we learn from past mistakes, identify gaps, hit limits, need to protect new technologies, and then go and do our best to solve those new security challenges with the technologies at hand.
The era of AI (let’s be clear, we have had AI for a long time; what I mean specifically is the advent of Large Language Models) has shifted many industries, but specifically security in a particularly revealing way. AI did not just give us new tools to solve security problems. It invited innovators and entrepreneurs to revisit pretty much every security technology to see if LLMs could be useful to address some of the existing challenges. But that’s not where things stopped. More interestingly, some teams used this moment to question whether the underlying approaches themselves still made sense at all. Not just whether LLMs could help, but whether modern data architectures, different telemetry choices, and different enforcement models could fundamentally change outcomes.
That is what has triggered a real wave of new companies in cyber, including across markets that many considered mature, or even stagnant, like SIEM.
The Five Phases We Just Lived Through
Let’s take a non-scientific look at how major security approaches evolved over the past 25 years. This is not exhaustive, but it helps explain where we are today.
1. Network-Centric Prevention
Back, many moons ago, we started with firewalls, IDS, and later IPS. The model was simple. Look at packets. Stop bad things. It worked until attackers learned to look normal.
2. More Data, Centralized, Higher-Level Insights
When network telemetry created too many false positives, we added vulnerability data and authentication events and fed them into a SIEM to correlate. The results were “mixed”. Fortunately for the SIEM market, compliance and audit requirements emerged, mandating long-term log retention. This gave SIEM a durable justification, even when its security value was debated. SIEM became indispensable for visibility and forensics, but increasingly disconnected from real-time decision making.
3. Back to Prevention and Response
As SIEM alert volumes exploded and analysts could not keep up, the industry pivoted. EDR. NDR. SOAR. We all know how that played out. NDR never truly broke out. EDR became a major category. SOAR largely collapsed back into SIEM. And eventually, most large EDR vendors added a SIEM to their portfolio.
This was not convergence by design. It was convergence driven by operational gravity.
4. AI Triggers a Reality Check
LLMs made many believe they could simply layer AI on top of broken architectures. Some startups did exactly that. They will likely not be the long-term winners.
The more interesting group of companies used AI as a forcing function to re-examine first principles. What data actually matters? What can realistically be prevented at the edge? What must still be correlated centrally? What is structurally broken in SOC workflows? Where have we been compensating for bad architecture with human labor? Crucially, many of these answers have little to do with LLMs themselves, and much more to do with data fidelity, placement of control, and modern system design. This is where the real innovation is happening.
5. The Convergence
We are now in a phase where prevention is moving back to the edge, while analytics and orchestration remain central. Endpoints are smarter. Browsers are instrumented. Networks are being re-observed. Context is finally treated as a first-class input.
But there is still a SOC. There is still a central nervous system that correlates, reconstructs, explains, orchestrates, and proves what happened. Call it SIEM, security analytics, XDR, or AI SOC. The name is irrelevant. The function is not.
In parallel, we are realizing that we can push enforcement / prevention back to the edge. Wherever we have enough information, execute at the edge. Where we don’t, call out to your central nervous system. To your brain. The brain (your SIEM) that understands at any moment in time, what the risk and function is of every entity in your network. And use that information for decision making.
Why AI SOC Will Collapse Back Into SIEM
Many startups brand themselves as “AI SOC”. What do they actually do?
They primarily ingest alerts from EDR, NDR, SIEMs, and cloud platforms, then attempt to determine which ones matter. They add context, apply behavioral analysis, and suppress false positives.
In other words, they attempt to do what SIEM, UEBA, and SOAR were always supposed to do, just with better math and more compute. However, there is one problem. Many of the AI SOC contenders operate on alert streams. That means they start from already lossy, opinionated data. Real behavioral analysis does not on top of alert streams. It lives in raw telemetry. Email flows. Network sessions. Browser actions. Endpoint system behavior.
Once an AI SOC platform decides to ingest that raw data directly, it immediately recreates the ingestion, normalization, storage, and correlation problems that SIEM already exists to solve. At that point, the separation no longer makes sense. This is exactly why UEBA and SOAR collapsed back into SIEM. And it is why AI SOC will do the same.
There will be one place where data is reconciled, correlated, and turned into decisions. That place will increasingly run on federated, near-real-time architectures rather than twenty-year-old indexing engines. But their function remains the same. Call it whatever you want. It needs to be one system, not many and it doesn’t care what you call it.
The Shift Is Not Just Technical. It Is Organizational.
What is interesting to note about these new entrants in the SIEM or security analytics space is not just their security architecture. It is the company architecture. Modern security startups are being built on AI-native operating systems: Sales calls are captured and analyzed, not just by sales, but product teams mine them for competitive signals, marketing uses them to refine messaging, engineering uses them to prioritize roadmaps. This is not a tooling upgrade. It is a fundamentally different operating model.
Imagine a system where the vision, mission, strategy, and priorities are centrally maintained, updated and codified. Every function consumes that shared intelligence to drive decisions, messaging, and execution. This does not just improve alignment. It dramatically compresses learning cycles and execution speed. And that, more than any individual feature, may be the hardest thing for incumbents to replicate.
Every few years in security, a category shows up that makes you think: “This market should have never existed.”
The “security data pipeline / data fabric / routing” universe is exactly that. Impressive companies in the space, smart founders, great execution and (thank you Observo!) great exists already. But the fact that there is a market here is the real indictment. This category is nothing more than a gap SIEM vendors left wide open. And the pipelines walked right in.
A Market That Shouldn’t Exist
Let’s be honest: Splunk, Elastic, Sentinel, Exabeam… they all ignored the ingest problem for too long. Cost, routing, shaping, tiering — none of it was solved cleanly. So Cribl et al solved it for them. But here’s the twist. By solving it, they also became the neutral abstraction layer. The thing sitting between customers and their SIEM. That layer is now the switching fabric. It isn’t just “optimize your Splunk bill.” It’s:
Reduce SIEM ingestion.
Store everything in our “cheap” data lake.
Oh, and here’s some lightweight analytics while you’re here.
Or how about you go ahead and try out another SIEM? We can easily forward your data to multiple places while you evaluate moving away and then switching in a matter of hours.
That’s the Trojan Horse. You invite it in to help. And suddenly it controls the keys to the castle.
History Is Repeating Itself
We’ve seen this play before:
UEBA -> first standalone products slowly morphed into adding data stores, analytics, and then became full SIEMs
SOAR -> got absorbed into SIEM
Ingest pipelines -> now becoming lakes -> and eventually a SIEM
Cribl already has Cribl Lake. Give it time and it becomes a SIEM-lite. Then a SIEM.
This is the cycle: Start as an add-on -> become indispensable -> become the platform.
We keep acting surprised. But it’s the same movie every time. And again, keep thinking about the switching costs. This layer enables every customer to easily evaluate new solutions and switch over fairly easily.
If You’re Splunk… I mean Cisco…
You’re one of the few players that can still turn this around — if you execute sharply and fast.
Here’s what Splunk must own again:
Reclaim the ingest pipeline.
Make cost the advantage, not the penalty.
Federate search across data lakes natively. (I think you are almost there)
Make tiering and reduction a first-class feature.
Kill the routing layer through pure convenience.
Figure out your real-time story. Crowdstrike is going strong on messaging how fast attackers act these days and a batch approach won’t work anymore.
If Splunk doesn’t own the control plane, Cribl will. And once you lose the control plane, you lose the customer. No matter how good your detection content is. Cisco gives Splunk a rare opportunity: distribution, integration leverage, and a chance to fix what was ignored for too long. But they can’t let another category grow unchecked. Not again.
My Take
Data pipeline products aren’t the problem. They are the symptom.
The problem is the complacency that let the ingest layer drift outside the SIEM in the first place. Because once a neutral fabric handles all your data, the SIEM becomes swappable. The next SIEM won’t start as a SIEM. It will start exactly where Cribl started; as a pipeline (Abstract Security, anyone)? That’s the Trojan Horse.
Last week I keynoted LogPoint’s customer conference with a talk about how to extract value from security data. Pretty much every company out there has tried to somehow leverage their log data to manage their infrastructure and protect their assets and information. The solution vendors have initially named the space log management and then security information and event management (SIEM). We have then seen new solutions pop up in adjacent spaces with adjacent use-cases; user and entity behavior analytics (UEBA) and security orchestration, automation, and response (SOAR) platforms became add-ons for SIEMs. As of late, extended detection and response (XDR) has been used by some vendors to try and regain some of the lost users that have been getting increasingly frustrated with their SIEM solutions and the cost associated for not the return that was hoped for.
In my keynote I expanded on the logging history (see separate post). I am touching on other areas like big data and open source solutions as well and go back two decades to the origins of log management. In the second section of the talk, I shift to the present to discuss some of the challenges that we face today with managing all of our security data and expand on some of the trends in the security analytics space. In the third section, we focus on the future. What does tomorrow hold in the SIEM / XDR / security data space? What are some of the key features we will see and how does this matter to the user of these approaches.
Enjoy the video and check out the slides below as well:
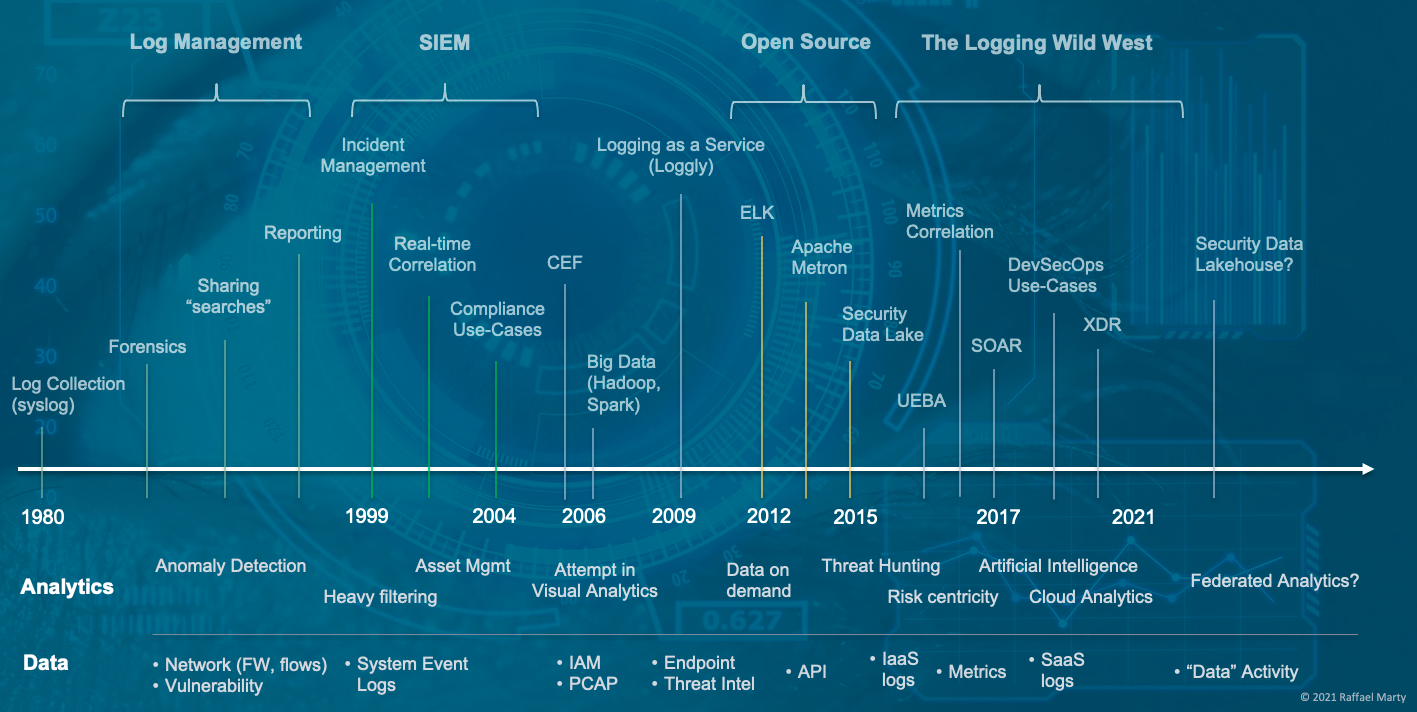
The log management and security information management (SIEM) space have gone through a number of stages to arrive where they are today. I started mapping the space in the 1980’s when syslog entered the world. To make sense of the really busy diagram, the top shows the chronological timeline (not in equidistant notation!), the second swim lane underneath calls out some milestone analytics components that were pivotal at the given times and the last row shows what data sources were added a the given times to the logging systems to gain deeper visibility and understanding. I’ll let you digest this for a minute.
What is interesting is that we started the journey with log management use-cases which morphed into an entire market, initially called the SIM market, but then officially being renamed to security information and event management (SIEM). After that we entered a phase where big data became a hot topic and customers started toying with the idea of building their own logging solutions. Generally not with the best results. But that didn’t prevent some open source movements from entering the map, most of which are ‘dead’ today. But what happened after that is even more interesting. The entire space started splintering into multiple new spaces. First it was products that called themselves user and entity behavior analytics (UEBA), then it was SOAR, and most recently it’s been XDR. All of which are really off-shoots of SIEMs. What is most interesting is that the stand-alone UEBA market is pretty much dead and so is the SOAR market. All the companies either got integrated (acquired) into existing SIEM platforms or added SIEM as an additional use-case to their own platform.
XDR has been the latest development and is probably the strangest of all. I call BS on the space. Some vendors are trying to market it as EDR++ by adding some network data. Others are basically taking SIEM, but are restricting it to less data sources and a more focused set of use-cases. While that is great for end-users looking to solve those use-cases by giving them a better experience, it’s really not much different from what the original SIEMs have been built to do.
If you have a minute and you want to dive into some more of the details of the history, following is a 10 minute video where I narrate the history and highlight some of the pivotal areas, as well as explain a bit more what you see in the timeline.
Thanks to some of my industry friends, Anton, Rui, and Lennart who provided some input on the timeline and helped me plug some of the gaps!
If you liked the short video on the logging history, make sure to check out the full video on the topic of “Driving Value From Security Data”
We have been collecting data to drive security insights for over two decades. We call these tools log management solutions, SIMs (security information management), and XDRs (extended detection and response) platforms. Some companies have also built their own solutions on top of big data technologies. It’s been quite the journey.
At the upcoming ThinkIn conference that LogPoint organized on June 8th, I had the honor of presenting the morning keynote. The topic was “How To Drive Value with Security Data“. I spent some time on reviewing the history of security data, log management, and SIEM. I then looked at where we face most challenges with today’s solutions and what the future holds in this space. Especially with the expansion of the space around UEBA, XDR, SOAR, and TIP, there is no such thing as a standardized platform that one would use to get ahead of security attacks. But what does that mean for you as a consumer or security practitioner, trying to protect your business?
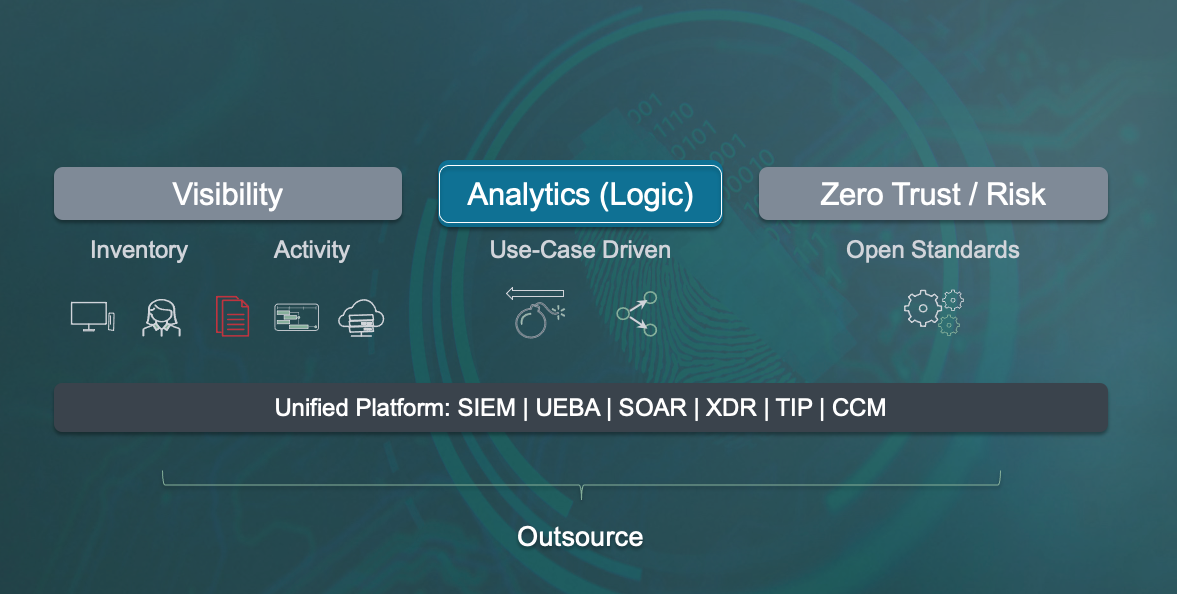
Following is the final slide of the presentation as a bit of a teaser. This is how I summarize the space and how it has to evolve. I won’t take away the thunder and explain the slide just yet. Did you tune into the keynote to get the description?
Once again, at BlackHat Las Vegas, I will be teaching the Visual Analytics for Security Workshop. This is the 5th year in a row that I’ll be teaching this class at BlackHat US. Overall, it’s the 29th! time that I’ll be teaching this workshop. Every year, I spend a significant amount of time to get the class updated with the latest trends and developments.
This year, you should be excited about the following new and updated topics:
– Machine learning in security – what is it really?
– What’s new in the world of big data?
– Hunting to improve your security insights
– The CISO dashboard – a way to visualize your security posture
– User and Entity Behavior Analytics (UEBA) – what it is, what it isn’t, and you use it most effectively
– 10 Challenges with SIEM and Big Data for security
Don’t miss the 5th anniversary of this workshop being taught at BlackHat US. Check out the details and sign up today: http://bit.ly/2kEXDEr
Okay, this post is going to be a bit strange. It’s a quick brain dump from a technical perspective, what it would take to build the perfect security monitoring environment.
We’d need data and contextual information to start with:
information classification and location (tracking movement?)
HR / presonell information
vulnerability scans
configuration information for each machine, network device, and application
With all this information, what are the different jobs / tasks / themes that need to be covered from a data consumption perspective?
situational awareness / dashboards
alert triage
forensic investigations
metric generation from raw logs / mapping to some kind of risk
incident management / sharing information / collaboration
hunting
running models on the data (data science)
anomaly detection
behavioral analysis
scoring
reports (PDF, HTML)
real-time matching against high volume threat feeds
remediating security problems
continuous compliance
controls verification / audit
What would the right data store look like? What would its capabilities be?
storing any kind of data
kind of schema less but with schema on demand
storing event data (time-stamped data, logs)
storing metrics
fast random access of small amounts of data, aka search
analytical questions
looking for ‘patterns’ in the data – maybe something like a computer science grammar that defines patterns
building dynamic context from the data (e.g., who was on what machine at what time)
anonymization
Looks like there would probably be different data stores: We’d need an index, probably a graph store for complex queries, a columnar store for the analytical questions, pre-aggregated data to answer some of the common queries, and the raw logs as well. Oh boy 😉
I am sure I am missing a bunch of things here. Care to comment?
Hunting has been a fairly central topic on this blog. I have written about different aspects of hunting here and here.
I just gave a presentation at the Kaspersky Security Analytics Summit where I talked about the concept of internal threat intelligence and showed a number of visualizations to emphasize the concept of interactive discovery to find behavior that really matters in your network.
VCs pay attention: There is an opportunity here, but it is going to be risky 😉 If you want to fund this, let me know.
In short: We need a company that builds and supports the data processing backend for all security products. Make it open source / free. And I don’t think this will be Cloudera. It’s too security specific. But they might have money to fund it? Tom?
I have had my frustrations with the security industry lately. Companies are not building products anymore, but features. Look at the security industry: You have a tool that does behavioral modeling for network traffic. You have a tool that does scoring of users based on information they extract from active directory. Yet another tool does the same for Linux systems and the next company does the same thing for the financial industry. Are you kidding me?
If you are a CISO right now, I don’t envy you. You have to a) figure out what type of products to even put in your environment and b) determine how to operate those products. We are back at where we were about 15 years ago. You need a dozen consoles to gain an understanding of your overall security environment. No cross-correlation, just an oportunity to justify the investment into a dozen screens on each analysts’ desk. Can we really not do better?
One of the fundamental problems that we have is that every single product re-builds the exact same data stack. Data ingestion with parsing, data storage, analytics, etc. It’s exactly the same stack in every single product. And guess what; using the different products, you have to feed all of them the exact same data. You end up collecting the same data multiple times.
We need someone – a company – to build the backend stack once and for all. It’s really clear at this point how to do that: Kafka -> Spark Streaming – Parquet and Cassandra – Spark SQL (maybe Impala). Throw some Esper in the mix, if you want to. Make the platform open so that everyone can plug in their own capabilities and we are done. Not rocket science. Addition: And it should be free / open source!
The hard part comes after. We need every (end-user) company out there to deploy this stack as their data pipeline and storage system (see Security Data Lake). Then, every product company needs to build their technology on top of this stack. That way, they don’t have to re-invent the wheel, companies don’t have to deploy dozens of products, and we can finally build decent product companies again that can focus on their core capabilities.
Now, who is going to fund the product company to build this? We don’t have time to go slow like Elastic in the case of ElasticSearch or RedHat for Linux. We need need this company now; a company that pulls together the right open source components, puts some glue between them, and offers services and maintenance.
Afterthought: Anyone feel like we are back in the year 2000? Isn’t this the exact same situation that the SIEMs were born out of? They promised to help with threat detection. Never delivered. Partly because of the technologies used (RDBMS). Partly due to the closeness of the architecture. Partly due to the fact that we thought we could come up with some formula that computes a priority for each event. Then look at priority 10 events and you are secure. Naive; or just inexperienced. (I am simplifying, but the correlation part is just an add-on to help find important events). If it weren’t for regulations and compliance use-cases, we wouldn’t even speak of SIEMs anymore. It’s time to rebuild this thing the right way. Let’s learn from our mistakes (and don’t get me started what all we have and are still doing wrong in our SIEMs [and those new “feature” products out there]).