Security has always moved in waves. Not because we suddenly get smarter, but because we learn from past mistakes, identify gaps, hit limits, need to protect new technologies, and then go and do our best to solve those new security challenges with the technologies at hand.
The era of AI (let’s be clear, we have had AI for a long time; what I mean specifically is the advent of Large Language Models) has shifted many industries, but specifically security in a particularly revealing way. AI did not just give us new tools to solve security problems. It invited innovators and entrepreneurs to revisit pretty much every security technology to see if LLMs could be useful to address some of the existing challenges. But that’s not where things stopped. More interestingly, some teams used this moment to question whether the underlying approaches themselves still made sense at all. Not just whether LLMs could help, but whether modern data architectures, different telemetry choices, and different enforcement models could fundamentally change outcomes.
That is what has triggered a real wave of new companies in cyber, including across markets that many considered mature, or even stagnant, like SIEM.
The Five Phases We Just Lived Through
Let’s take a non-scientific look at how major security approaches evolved over the past 25 years. This is not exhaustive, but it helps explain where we are today.
1. Network-Centric Prevention
Back, many moons ago, we started with firewalls, IDS, and later IPS. The model was simple. Look at packets. Stop bad things. It worked until attackers learned to look normal.
2. More Data, Centralized, Higher-Level Insights
When network telemetry created too many false positives, we added vulnerability data and authentication events and fed them into a SIEM to correlate. The results were “mixed”. Fortunately for the SIEM market, compliance and audit requirements emerged, mandating long-term log retention. This gave SIEM a durable justification, even when its security value was debated. SIEM became indispensable for visibility and forensics, but increasingly disconnected from real-time decision making.
3. Back to Prevention and Response
As SIEM alert volumes exploded and analysts could not keep up, the industry pivoted. EDR. NDR. SOAR. We all know how that played out. NDR never truly broke out. EDR became a major category. SOAR largely collapsed back into SIEM. And eventually, most large EDR vendors added a SIEM to their portfolio.
This was not convergence by design. It was convergence driven by operational gravity.
4. AI Triggers a Reality Check
LLMs made many believe they could simply layer AI on top of broken architectures. Some startups did exactly that. They will likely not be the long-term winners.
The more interesting group of companies used AI as a forcing function to re-examine first principles. What data actually matters? What can realistically be prevented at the edge? What must still be correlated centrally? What is structurally broken in SOC workflows? Where have we been compensating for bad architecture with human labor? Crucially, many of these answers have little to do with LLMs themselves, and much more to do with data fidelity, placement of control, and modern system design. This is where the real innovation is happening.
5. The Convergence
We are now in a phase where prevention is moving back to the edge, while analytics and orchestration remain central. Endpoints are smarter. Browsers are instrumented. Networks are being re-observed. Context is finally treated as a first-class input.
But there is still a SOC. There is still a central nervous system that correlates, reconstructs, explains, orchestrates, and proves what happened. Call it SIEM, security analytics, XDR, or AI SOC. The name is irrelevant. The function is not.
In parallel, we are realizing that we can push enforcement / prevention back to the edge. Wherever we have enough information, execute at the edge. Where we don’t, call out to your central nervous system. To your brain. The brain (your SIEM) that understands at any moment in time, what the risk and function is of every entity in your network. And use that information for decision making.
Why AI SOC Will Collapse Back Into SIEM
Many startups brand themselves as “AI SOC”. What do they actually do?
They primarily ingest alerts from EDR, NDR, SIEMs, and cloud platforms, then attempt to determine which ones matter. They add context, apply behavioral analysis, and suppress false positives.
In other words, they attempt to do what SIEM, UEBA, and SOAR were always supposed to do, just with better math and more compute. However, there is one problem. Many of the AI SOC contenders operate on alert streams. That means they start from already lossy, opinionated data. Real behavioral analysis does not on top of alert streams. It lives in raw telemetry. Email flows. Network sessions. Browser actions. Endpoint system behavior.
Once an AI SOC platform decides to ingest that raw data directly, it immediately recreates the ingestion, normalization, storage, and correlation problems that SIEM already exists to solve. At that point, the separation no longer makes sense. This is exactly why UEBA and SOAR collapsed back into SIEM. And it is why AI SOC will do the same.
There will be one place where data is reconciled, correlated, and turned into decisions. That place will increasingly run on federated, near-real-time architectures rather than twenty-year-old indexing engines. But their function remains the same. Call it whatever you want. It needs to be one system, not many and it doesn’t care what you call it.
The Shift Is Not Just Technical. It Is Organizational.
What is interesting to note about these new entrants in the SIEM or security analytics space is not just their security architecture. It is the company architecture. Modern security startups are being built on AI-native operating systems: Sales calls are captured and analyzed, not just by sales, but product teams mine them for competitive signals, marketing uses them to refine messaging, engineering uses them to prioritize roadmaps. This is not a tooling upgrade. It is a fundamentally different operating model.
Imagine a system where the vision, mission, strategy, and priorities are centrally maintained, updated and codified. Every function consumes that shared intelligence to drive decisions, messaging, and execution. This does not just improve alignment. It dramatically compresses learning cycles and execution speed. And that, more than any individual feature, may be the hardest thing for incumbents to replicate.
And why most of the arguments do not hold up under scrutiny
Over the past 18 to 24 months, venture capital has flowed into a fresh wave of SIEM challengers including Vega (which raised $65M in seed and Series A at a ~$400M valuation), Perpetual Systems, RunReveal, Iceguard, Sekoia, Cybersift, Ziggiz, and Abstract Security, all pitching themselves as the next generation of security analytics. What unites them is not just funding but a shared narrative that incumbent SIEMs are fundamentally broken: too costly, too siloed, too hard to scale, and too ineffective in the face of modern data volumes and AI-driven threats.
This post does not belabor each startup’s product. Instead it abstracts the shared assertions that justify recent funding and then stresses them to see which hold up under scrutiny. I am not defending incumbents. I am trying to separate real gaps from marketing (and funding) narratives.
The “SIEM is Broken” Narrative
A commonly cited industry report claimed that major SIEM tools cover only about 19% of MITRE ATT&CK techniques despite having access to data that could cover ~87%. That statistic is technically interesting but also deeply misleading: ATT&CK technique coverage is not an operational measure of detection quality or effectiveness, it primarily reflects rule inventory and tuning effort. Nevertheless, it has become a core justification for the “SIEM is obsolete” narrative. I wasn’t able to find the original report to validate what and how they tested, but I have seen SIEMs that cover much more and have big detection teams taking care of these issues.
The Five Core Claims Driving the Market Thesis
Across decks, interviews, and marketing copy, I picked five recurring themes that define what these companies think incumbents get wrong and what investors are underwriting as the path forward.
1. “Centralized SIEM architectures no longer scale”
The claim is that forcing security telemetry into a centralized repository is too expensive and too slow for modern enterprises generating terabytes of logs every day. The proposed fixes include federated queries, analyzing data where it lives, and decoupling detection from ingestion so you never have to move or duplicate all your data.
The challenge is that correlation, state, timelines, and real-time detection require locality. Distributed query engines excel at ad-hoc exploration but are not substitutes for continuous detection pipelines. Federated queries introduce latency, inconsistent performance, and complexity every time you write a detection. Normalization deferred to query time pushes complexity into every rule. You do not eliminate cost, you shift it to unpredictable query execution and compute costs that spike precisely when incidents occur. Centralizing data isn’t a flaw; it is a tradeoff that supports correlation engines, summary indexes, entity timelines, and stateful detections that distributed query models struggle to maintain in real time. In fact, if the SIEM was to store the data in the customer’s S3 bucket, you can keep cost somewhat under control.
2. “SIEM pricing is broken because it charges by data volume”
A frequent refrain is that incumbent SIEMs penalize good security hygiene by tying pricing to ingestion volume, which becomes untenable as data grows. The proposed response is pricing models untethered from volume, open storage, and customer-controlled compute.
The challenge is that cost doesn’t vanish because you hide volume. Compute, memory, enrichment, retention, and query costs all remain. If pricing is detached from ingestion, it typically reappears as unpredictable query charges, usage tiers, or gated features. Volume is not an arbitrary metric; it correlates with the cost a vendor (or customer) incurs. Treating cost as orthogonal to data volume does not make it disappear; it just blinds you to a key cost driver. I have dealt with all the pricing models: by user, by device, by volume, … in the end I needed to make my gross margins work, guess who pays for that?
3. “SIEM detections are weak because they rely on bad rules”
New entrants commonly assert that traditional SIEM rules are noisy, static, and unable to keep up with modern threat techniques. Solutions offered include natural-language detections, detections-as-code, continuous evaluation, and AI-generated rules.
The challenge is that many of these still sit atop the same primitives. For example, SIGMA is widely used as a community detection language, but it is fundamentally limited: it is mostly single-event, cannot express event ordering or causality, has no native temporal abstractions or entity-centric modeling, and cannot natively express thresholds, rates, cardinality, or statistical baselines. Wrapping these limitations in AI or “natural language” does not change the underlying detection physics. You can improve workflow and authoring experience, but you do not fundamentally invent a new class of detection with the same primitives. And guess what, large vendors have pretty significant content teams – I mean detection engineering teams – often tied into their threat research labs. Don’t tell me that a startup has found a more cost effective and higher efficacy way to release detection rules. If that were the case, all these large vendors would be dumb to operate such large teams.
4. “SIEMs lack context, causing false positives”
The argument here is that existing SIEMs flood analysts with alert noise because they lack deep asset context, threat intelligence, or behavioral understanding. New entrants promise tightly integrated TI feeds, cloud context, or built-in behavior analytics.
Context integration has been a focus of incumbent platforms for years. The real hard problem is not accessing context but operationalizing it without drowning analysts. More feeds often mean more noise unless you have mature enrichment pipelines, entity resolution, and risk scoring built into rules that understand multi-stage attack sequences. Adding more sources does not automatically improve signal quality. The noise problem is as much about rule quality and use-case focus as it is about context availability. Apply the same argument here with regards to the quality of threat feeds that I outlined in the last item.
5. “AI-native SIEMs will finally fix detection and response”
Perhaps the most seductive claim is that incumbent SIEMs were built for a pre-AI world and that new platforms built with agentic AI at every layer will finally crack automation, detection, and investigation.
The challenge is that AI does not eliminate the need for structured, high-quality, normalized data, or explainability, or deterministic behavior in high-risk contexts. AI can accelerate workflows, assist with investigation, and suggest hypotheses, but it does not replace the need for precise, reproducible, and auditable detection logic. Most AI-native claims today are improvements in UX and speed, not architectural breakthroughs in detection theory.
The Uncomfortable Conclusion
VC money is flowing because SIEM is operationally hard, expensive, and often unpopular with SOC teams. There is real pain and real gaps, especially around cost transparency, scaling, and usability. But declaring existing SIEMs obsolete because they are imperfect is not a thesis; it is a marketing slogan.
The core assumptions driving this funding wave deserve scrutiny: centralization is treated as a flaw rather than a tradeoff necessary for continuous detection, pricing complaints get conflated with architectural insights, detection quality is blamed on tooling rather than operational realities, and AI is overstated as a panacea.
On the flip side, here are a couple of directions that should be looked at:
Some of the new entrant SIEMs actually make a dent. They are rebuilding their entire pipelines and storage architecture with modern technologies, not old paradigms. They have a clear advantage and don’t have to deal with millions of lines of tech debt. Using an agentic AI architecture could be quite interesting here.
As the AI SOC emerges – and maybe become a reality – we will probably see more and more MCP servers exposing infrastructure information that can be leveraged, from alerts to context to response capabilities. But we’ll need to see how data schemas and all that will evolve.
The one innovation that has already generated some returns for investors is the entire data pipeline world. Companies like Observo (I had the privilege to be an advisor) have truly added something useful to the SIEMs and as I argue in one of my previous blogs, needs to really become a capability baked into each SIEM out there.
Everyone is suddenly looking at MSP and MSSP rollups. Investors, strategics, even VCs. The logic is obvious. Fragmented market, recurring revenue, sticky customer relationships. But the reality is that only a small subset of providers actually operate at a level worth scaling. The difference between an average MSSP and a good one comes down to a few fundamentals.
Start With Focus
Most MSPs never defined who they serve. They grew organically, took whatever customer showed up, and built a toolkit around individual fires rather than a repeatable model. A strong MSSP starts with clarity. Who is the ICP. What problem is being solved. What the operating model looks like for that segment. When this is missing, everything becomes random. Different tools. Different service quality. No leverage.
In practice, the most important segmentation is not the MSP itself, but who the MSP sells to. An MSP serving restaurants or spas has a fundamentally different security maturity, willingness to pay, and regulatory exposure than one serving regional banks, healthcare, or regulated SMBs. Treating them as one market leads to mispriced risk and churn.
Understand the Economics
Many MSPs think software licensing is their main cost. It is not. Labor dominates the model. At ConnectWise, our Service Leadership dataset showed that roughly 20 percent of MSPs were not profitable because they simply did not understand their own cost structure. The best ones hit around 20 to 25 percent EBITDA. They standardize. They price correctly. They run the business with discipline instead of firefighting.
The real margin killer is not the license costs. It is the technician minutes required to install, manage, respond, document, and bill every tool. Every additional product increases operational drag, even if the license is cheap.
Standardized Security Bundles Win
The MSSPs that scale do not let customers choose their own adventure. They define a required stack. If you want to be a customer, you adopt their bundle. This gives consistency, predictability, and actual security outcomes. A typical bundle includes:
• Patch and vulnerability management • Endpoint protection • Email security • Security awareness • Optional SIEM or MDR depending on the segment
Without standardization, you cannot maintain margins or guarantee service quality. You also make incident response dramatically harder because every environment looks different.
In reality, the bundle is usually sold at a fixed price like $50 to $100 per user per month. Any new security tool must fit inside that number. If it costs $2 to $3 per user, something else must be removed or margin gets cut. This is why getting into the bundle is harder than most vendors expect.
Service Quality Is the Product
SMBs want to be secure. They want minimal disruption. And when something goes wrong, they want a real human who knows what they are doing. Not tier 1 scripts. Not delays during an active incident. Good MSSPs prepare the customer during onboarding. They map critical systems, define escalation paths, understand what can be taken offline, and capture credentials and architecture details. They remove the guesswork from the moment the incident starts.
Billing Needs To Be Simple
One of the fastest ways to lose customers is confusing invoices. Customers want to understand what they pay for. Surprises create distrust. The MSSPs that retain well keep billing predictable, transparent, and boring.
Own the Response, Not Just the Alert
An MDR or MSSP that only notifies customers creates frustration. The provider must take the customer through remediation. For SMBs, response often means restoring operations, identifying the entry point, and closing the gap. If the MSSP cannot do this internally, it must have reliable partners.
How Rollups Actually Create Value
Rollups only work when there is a clear thesis. Some focus on platform unification and a single delivery model. Others focus on professionalizing the business with better hiring, benefits, pricing, and operational rigor. Both paths can work. But they require patience and real operating muscle.
The fastest way to build a defensible platform is often not direct MS(S)P sales but embedding into existing security vendors that already sit in the bundle. Winning a technology alliance with an EDR, MDR, or firewall provider puts you into hundreds of MSPs without forcing each of them to make a new buying decision
Cross border rollups in Europe introduce more complexity. Language and local relationships matter. Regulation varies. Centralizing delivery is possible, but customer interaction often stays local. A standardized platform can still work if the ICP is consistent across regions.
The Microsoft Factor
Many SMBs already own security features through M365. Ignoring this leads to bloated stacks and poor pricing. Smart MSSPs align their offering with what customers already have and fill the real gaps.
The Bottom Line
Building a strong MSSP is not mysterious. It requires a defined ICP, a standardized security bundle, disciplined delivery, true incident readiness, transparent billing, and the ability to take customers all the way to resolution. The providers that do these things consistently are the ones worth scaling. Investors often chase the rollup story, but the real value sits inside the boring operational fundamentals that most of the market never gets right.
Over the past weeks, I’ve had a series of conversations across the cybersecurity ecosystem. Founders in early-stage security startups, VC firms exploring new segments, PE groups accelerating roll-ups, MSP leaders navigating change, and friends pushing the boundaries of what AI can do.
Individually, each conversation was fascinating. Taken together, they paint a picture of where the industry is heading — and where the real opportunities are emerging.
1. Network Security Isn’t Dead at All
One of the more surprising conversations was with a founder building something genuinely innovative in network security. For years, many assumed the category had settled — but the reality is that architectures, workloads, and adversaries continue to evolve. Even the DDoS and WAF spaces are not dead. To my surprise when I worked with one of the PEs to look at the space in more detail again.
The lesson: even “mature” markets have seams where real innovation can take hold.
2. The MSP Landscape Is Vast — and Misunderstood
I spoke with a VC firm considering deeper investments in the MSP ecosystem. There’s real opportunity, but also complexity that outsiders often underestimate:
Segmentation
Pricing mechanics
Packaged offerings
Integrations into broader ecosystems
and perhaps most importantly, helping MSPs actually sell security
Products don’t win in MSP without empathy for how MSPs operate and make money.
3. PE Roll-Ups Are Accelerating
One PE firm I talked to is running hard at the roll-up opportunity as the first generation of MSP founders, many starting in the late 90s, look to exit. Their playbook is all around optimized processes and joint buying power. While a European firm I am in touch with, is exploring consolidation not just for scale, but under a unified security platform strategy.
Two very different visions, both valid.
4. Connecting Leaders Amplifies Outcomes
A conversation with a European PE group was refreshing — they emphasize connecting portfolio company leaders so they can cross-pollinate learnings.
Having spent the past 18 months deep in my own leadership work (attending school for the past 18 months is a conversation for another day), I’ve become even more convinced that people dynamics are the highest leverage variable in cybersecurity execution. And it’s not just on the level of leadership that is being discussed widely. It’s about the differences in people and their unique styles. Again, a conversation for another day.
5. Building for MSPs Requires Being in Their Shoes
An MSP leader reminded me of a simple truth:
If you don’t understand the day-to-day realities of MSP life, you can’t build for them.
This applies to product, packaging, GTM, support, and everything in between.
6. AI: Beyond the Hype, Toward Real Value
I caught up with a friend who recently joined an AI company, and we talked about emerging approaches that leverage data inside the model and how one can connect their existing data stores to the various models. Love what they are building and I would have thought they were one of the hockey-stick companies, but it turns out, execution in a startup is hard and requires a lot of elbow greese.
The Unifying Thread
Across all these conversations, I keep coming back to one conclusion:
Security is fragmenting and converging at the same time: The biggest opportunities — for vendors, investors, and operators — are in the seams.
Ecosystems matter. Empathy matters. And clarity of execution matters more than ever.
It’s an exciting moment to be building in this industry.
At the Summa Equity Annual Investor Meeting in Oslo, I had the privilege of joining Jacob Frandsen on stage for a conversation about the state of cybersecurity and the broader forces shaping technology companies today. The dialogue revolved around four big questions. Each one central to how investors, founders, and operators should be thinking about the future:
1. Balancing Investing in Innovation vs. Delivering Profitability
“It’s not innovation or profitability. It’s knowing when and how to balance the two engines that drive growth.”
Innovation as survival – At smaller scale, innovation is paramount and innovation creates the moat that ensures relevance. Without it, companies risk being commoditized.
Profitability as discipline – Operational excellence, sales efficiency, and cost control are non-negotiable as you scale.
Two-engine model – Run one engine for profitability, another to push the edge of innovation.
AI disruption – Both of areas of profitability and innovation are nicely coming together with AI: AI applied in any are of a company are driving profitability, time to market, etc. On the other hand, entire cyber products are being rewritten with AI at the core. Missing the AI wave on either side kills your future relevance.
2. AI and Cyber: Opportunity and Risk
“AI is both a multiplier of capability and a source of new risks. Success comes from knowing when and how to use it.”
Force multiplier – AI accelerates development, marketing, sales, detection engineering, and lowers barriers for non-experts.
AI-led attacks – Still emerging, but attackers will adopt quickly — as defenders we must keep pace.
Security for AI – A number of new challenges we are facing. This will likely grow into its own market, but the fundamentals (data protection, trust, governance) remain the same.
3. Defensible Positions for Emerging Cyber Companies
Especially in the light of large security platforms like Crowdstrike or Microsoft or SentinelOne, how can smaller companies and startups be relevant at all?
“In cybersecurity, defensibility isn’t just about tech.”
Wedge strategy – Start narrow, with an overlooked market or product gap. For example, the MSP / SMB segment is still significantly underserved but presents a vast opportunity.
Data gravity – Unique datasets become the backbone of long-term defensibility, especially with AI to mine the data and make it actionable.
Ecosystem first – Build API-driven integrations that make you indispensable within workflows, rather than standing alone. Modern security organizations that are using one of the large platforms are still using about 20 other products to fill gaps. If those products are integrated into the larger platform it greatly reduces the complexity and ease for the operators. For the security vendors it opens up the opportunity for technology partnerships on the flip side.
4. Europe vs. US: Different Playbooks
“US is about speed and boldness; Europe is about trust and staying power — the opportunity for EU business is bridging both playbooks.”
Speed vs. trust – US rewards rapid scaling and bold claims; Europe emphasizes trust, compliance, references, and credibility. European customers are rarely early movers on new technologies.
Market fragmentation – Europe is highly localized; VARs and telcos dominate, with significant regional differences in regulation and go-to-market.
Talent edge – Europe offers strong technical talent from world-class universities. ETH anyone? 🙂
Opportunity – EU players can win by leaning into local strength; US entrants will struggle to replicate that quickly in all the markets. Adapting a product to local markets with different languages, different tax codes, cultures, labor laws, data privacy laws, etc. is a lot of work. That is why you see most US companies expand into UKI first and then slowly entering some of the countries in mainland Europe.
Closing Thoughts
The conversation reinforced for me that cybersecurity doesn’t exist in a vacuum. It intersects with innovation cycles, global talent pools, regulatory environments, and the transformative force of AI. Companies that thrive will be those that balance innovation with discipline, embrace ecosystems, and play the long game across diverse markets.
I left the stage energized. Not just by the challenges, but by the opportunities for European companies to seize if we approach them with clarity and conviction.
Last week I keynoted LogPoint’s customer conference with a talk about how to extract value from security data. Pretty much every company out there has tried to somehow leverage their log data to manage their infrastructure and protect their assets and information. The solution vendors have initially named the space log management and then security information and event management (SIEM). We have then seen new solutions pop up in adjacent spaces with adjacent use-cases; user and entity behavior analytics (UEBA) and security orchestration, automation, and response (SOAR) platforms became add-ons for SIEMs. As of late, extended detection and response (XDR) has been used by some vendors to try and regain some of the lost users that have been getting increasingly frustrated with their SIEM solutions and the cost associated for not the return that was hoped for.
In my keynote I expanded on the logging history (see separate post). I am touching on other areas like big data and open source solutions as well and go back two decades to the origins of log management. In the second section of the talk, I shift to the present to discuss some of the challenges that we face today with managing all of our security data and expand on some of the trends in the security analytics space. In the third section, we focus on the future. What does tomorrow hold in the SIEM / XDR / security data space? What are some of the key features we will see and how does this matter to the user of these approaches.
Enjoy the video and check out the slides below as well:
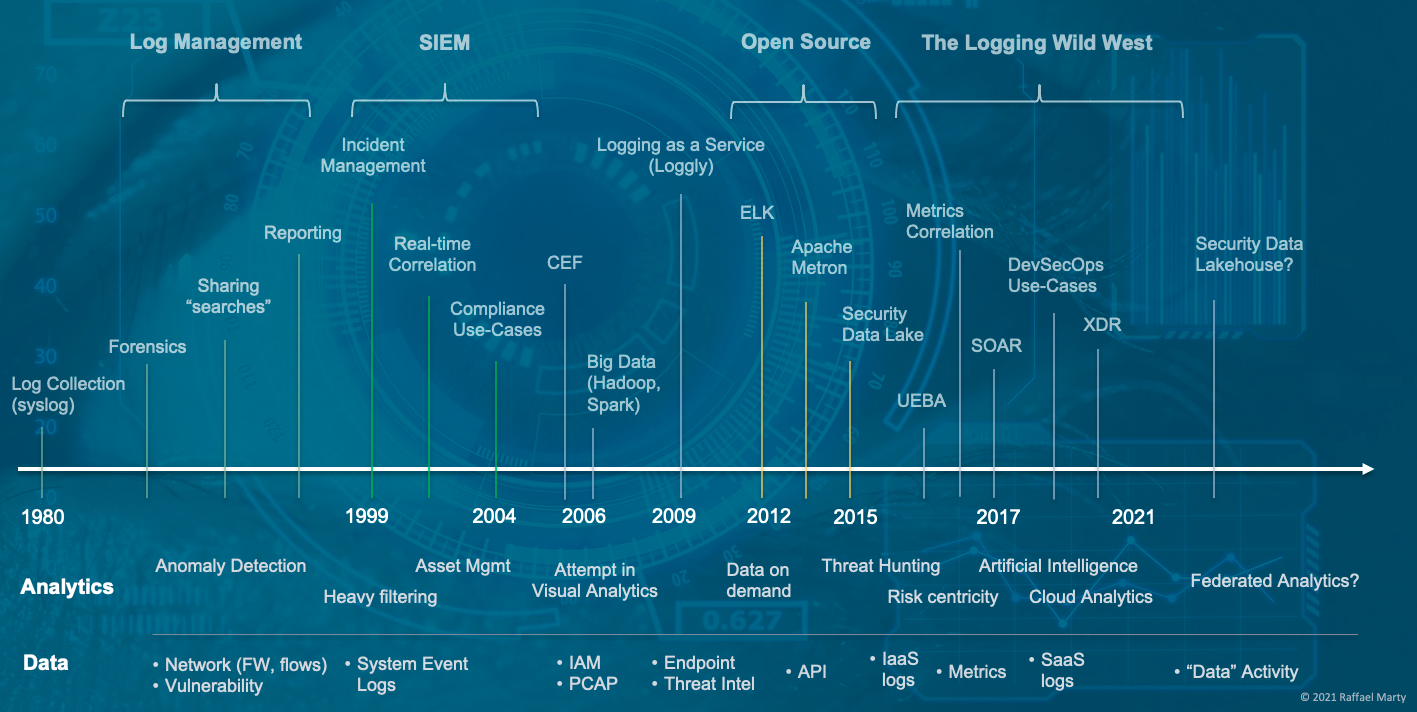
The log management and security information management (SIEM) space have gone through a number of stages to arrive where they are today. I started mapping the space in the 1980’s when syslog entered the world. To make sense of the really busy diagram, the top shows the chronological timeline (not in equidistant notation!), the second swim lane underneath calls out some milestone analytics components that were pivotal at the given times and the last row shows what data sources were added a the given times to the logging systems to gain deeper visibility and understanding. I’ll let you digest this for a minute.
What is interesting is that we started the journey with log management use-cases which morphed into an entire market, initially called the SIM market, but then officially being renamed to security information and event management (SIEM). After that we entered a phase where big data became a hot topic and customers started toying with the idea of building their own logging solutions. Generally not with the best results. But that didn’t prevent some open source movements from entering the map, most of which are ‘dead’ today. But what happened after that is even more interesting. The entire space started splintering into multiple new spaces. First it was products that called themselves user and entity behavior analytics (UEBA), then it was SOAR, and most recently it’s been XDR. All of which are really off-shoots of SIEMs. What is most interesting is that the stand-alone UEBA market is pretty much dead and so is the SOAR market. All the companies either got integrated (acquired) into existing SIEM platforms or added SIEM as an additional use-case to their own platform.
XDR has been the latest development and is probably the strangest of all. I call BS on the space. Some vendors are trying to market it as EDR++ by adding some network data. Others are basically taking SIEM, but are restricting it to less data sources and a more focused set of use-cases. While that is great for end-users looking to solve those use-cases by giving them a better experience, it’s really not much different from what the original SIEMs have been built to do.
If you have a minute and you want to dive into some more of the details of the history, following is a 10 minute video where I narrate the history and highlight some of the pivotal areas, as well as explain a bit more what you see in the timeline.
Thanks to some of my industry friends, Anton, Rui, and Lennart who provided some input on the timeline and helped me plug some of the gaps!
If you liked the short video on the logging history, make sure to check out the full video on the topic of “Driving Value From Security Data”
We have been collecting data to drive security insights for over two decades. We call these tools log management solutions, SIMs (security information management), and XDRs (extended detection and response) platforms. Some companies have also built their own solutions on top of big data technologies. It’s been quite the journey.
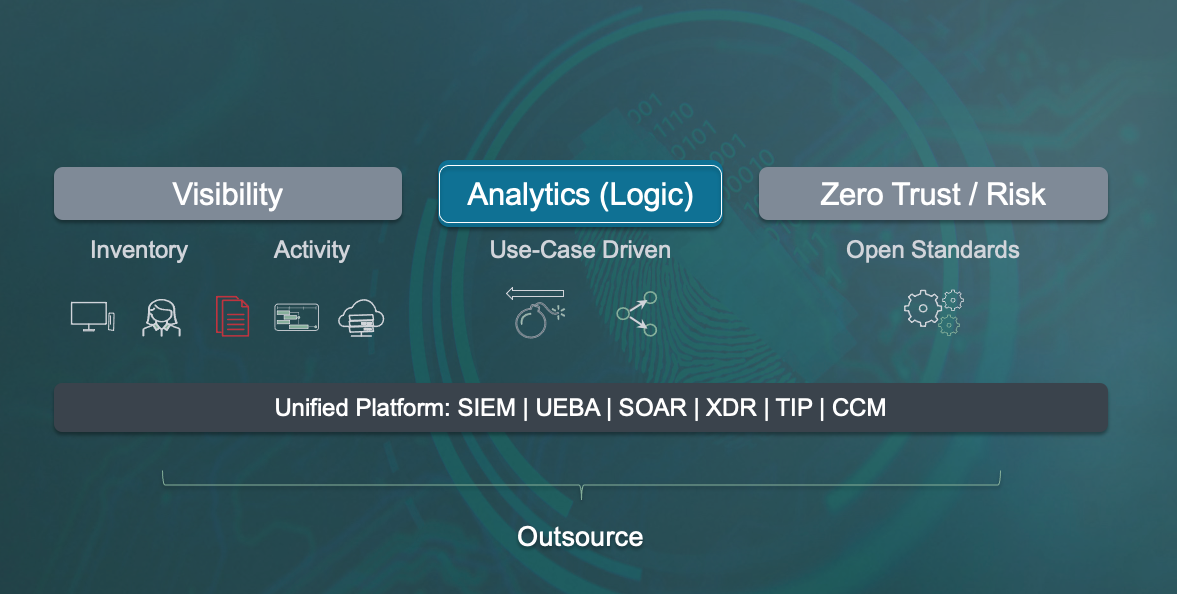
At the upcoming ThinkIn conference that LogPoint organized on June 8th, I had the honor of presenting the morning keynote. The topic was “How To Drive Value with Security Data“. I spent some time on reviewing the history of security data, log management, and SIEM. I then looked at where we face most challenges with today’s solutions and what the future holds in this space. Especially with the expansion of the space around UEBA, XDR, SOAR, and TIP, there is no such thing as a standardized platform that one would use to get ahead of security attacks. But what does that mean for you as a consumer or security practitioner, trying to protect your business?
Following is the final slide of the presentation as a bit of a teaser. This is how I summarize the space and how it has to evolve. I won’t take away the thunder and explain the slide just yet. Did you tune into the keynote to get the description?
Before diving into cyber security and how the industry is using AI at this point, let’s define the term AI first. Artificial Intelligence (AI), as the term is used today, is the overarching concept covering machine learning (supervised, including Deep Learning, and unsupervised), as well as other algorithmic approaches that are more than just simple statistics. These other algorithms include the fields of natural language processing (NLP), natural language understanding (NLU), reinforcement learning, and knowledge representation. These are the most relevant approaches in cyber security.
Given this definition, how evolved are cyber security products when it comes to using AI and ML?
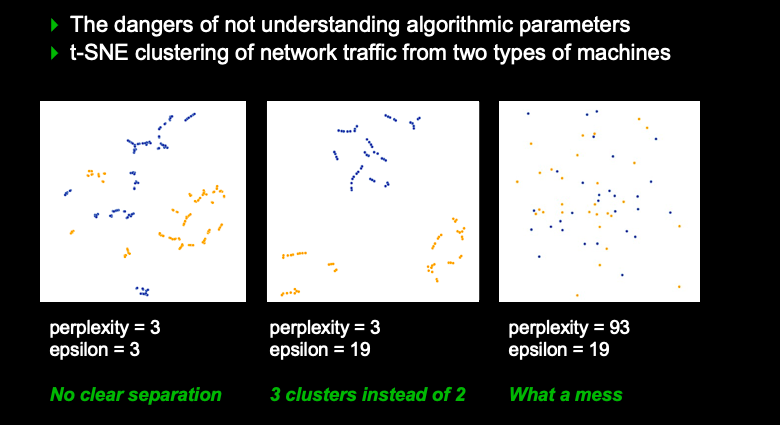
I do see more and more cyber security companies leverage ML and AI in some way. The question is to what degree. I have written before about the dangers of algorithms. It’s gotten too easy for any software engineer to play a data scientist. It’s as easy as downloading a library and calling the .start() function. The challenge lies in the fact that the engineer often has no idea what just happened within the algorithm and how to correctly use it. Does the algorithm work with non normally distributed data? What about normalizing the data before inputting it into the algorithm? How should the results be interpreted? I gave a talk at BlackHat where I showed what happens when we don’t know what an algorithm is doing.
Slide from BlackHat 2018 talk about “Why Algorithms Are Dangerous” showing what can go wrong by blindly using AI.
So, the mere fact that a company is using AI or ML in their product is not a good indicator of the product actually doing something smart. On the contrary, most companies I have looked at that claimed to use AI for some core capability are doing it ‘wrong’ in some way, shape or form. To be fair, there are some companies that stick to the right principles, hire actual data scientists, apply algorithms correctly, and interpret the data correctly.
Generally, I see the correct application of AI in the supervised machine learning camp where there is a lot of labeled data available: malware detection (telling benign binaries from malware), malware classification (attributing malware to some malware family), document and Web site classification, document analysis, and natural language understanding for phishing and BEC detection. There is some early but promising work being done on graph (or social network) analytics for communication analysis. But you need a lot of data and contextual information that is not easy to get your hands on. Then, there are a couple of companies that are using belief networks to model expert knowledge, for example, for event triage or insider threat detection. But unfortunately, these companies are a dime a dozen.
That leads us into the next question: What are the top use-cases for AI in security?
I am personally excited about a couple of areas that I think are showing quite some promise to advance the cyber security efforts:
Using NLP and NLU to understand people’s email habits to then identify malicious activity (BEC, phishing, etc). Initially we have tried to run sentiment analysis on messaging data, but we quickly realized we should leave that to analyzing tweets for brand sentiment and avoid making human (or phishing) behavior judgements. It’s a bit too early for that. But there are some successes in topic modeling, token classification of things like account numbers, and even looking at the use of language.
Leveraging graph analytics to map out data movement and data lineage to learn when exfiltration or malicious data modifications are occurring. This topic is not researched well yet and I am not aware of any company or product that does this well just yet. It’s a hard problem on many layers, from data collection to deduplication and interpretation. But that’s also what makes this research interesting.
Given the above it doesn’t look like we have made a lot of progress in AI for security. Why is that? I’d attribute it to a few things:
Access to training data. Any hypothesis we come up with, we have to test and validate. Without data that’s hard to do. We need complex data sets that are showing user interactions across applications, their data, and cloud apps, along with contextual information about the users and their data. This kind of data is hard to get, especially with privacy concerns and regulations like GDPR putting more scrutiny on processes around research work.
A lack of engineers that understand data science and security. We need security experts with a lot of experience to work on these problems. When I say security experts, these are people that have a deep understand (and hands-on experience) of operating systems and applications, networking and cloud infrastructures. It’s unlikely to find these experts who also have data science chops. Pairing them with data scientists helps, but there is a lot that gets lost in their communications.
Research dollars. There are few companies that are doing real security research. Take a larger security firm. They might do malware research, but how many of them have actual data science teams that are researching novel approaches? Microsoft has a few great researchers working on relevant problems. Bank of America has an effort to fund academia to work on pressing problems for them. But that work generally doesn’t see the light of day within your off the shelf security products. Generally, security vendors don’t invest in research that is not directly related to their products. And if they do, they want to see fairly quick turn arounds. That’s where startups can fill the gaps. Their challenge is to make their approaches scalable. Meaning not just scale to a lot of data, but also being relevant in a variety of customer environments with dozens of diverging processes, applications, usage patterns, etc. This then comes full circle with the data problem. You need data from a variety of different environments to establish hypotheses and test your approaches.
Is there anything that the security buyer should be doing differently to incentivize security vendors to do better in AI?
I don’t think the security buyer is to blame for anything. The buyer shouldn’t have to know anything about how security products work. The products should do what they claim they do and do that well. I think that’s one of the mortal sins of the security industry: building products that are too complex. As Ron Rivest said on a panel the other day: “Complexity is the enemy of security”.
Also have a look at the VentureBeat article feating some quotes from me.
On a recent consulting engagement with Cynergy Partners, we needed to decipher the security product market to an investment firm that normally doesn’t invest in cyber security. One of the investor’s concerns was that a lot of cyber companies are short-lived businesses due to the threats changing so drastically quick. One day it’s ransomware X, the next day it’s a new variant that defeats all the existing protective measures and then it’s a new SQL injection variant that requires a completely different security approach to stop it. How in the world would an investor ever get comfortable investing in a short-lived business like that?
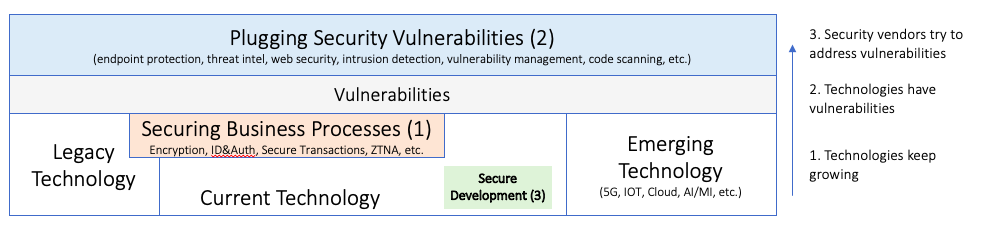
In light of trying to explain the security product market and to explain that there are not just security solutions that are chasing the next attack, we developed a model to highlight the fact that security often needs to be deeply embedded into business processes. As a result, it becomes far more likely for security solutions to have a longer ‘shelf-life’. Here is the diagram that helps explain the concept:
The diagram shows from left to right the technology evolution. You have legacy technology that is still running in organizations and drives businesses, for example your mainframes. Then you have current technologies and finally emerging technologies, such as 5G, IoT, AI, etc. All of the technologies have vulnerabilities that we learn about over time and we need to secure in some way. You can imagine that most every technology will need a different way to secure it, which creates the crazy complex ecosystem of security products and services.
With that setup, we end up in a world with three different types of security products, which
Secure Business Processes
Plug Security Vulnerabilities
Enable Secure Software Development
As you can quickly see, the first and third type of security solutions are ones that do not change with the type of attacks or exploits. They are more technology and business use-case oriented. That also means that security products do not need to change drastically if new vulnerabilities are discovered or new attack methods are being used by adversaries.
Showing this diagram for our investment client helped them get more comfortable that they are looking at an investment that lives on the ‘steady’ or ‘sticky’ side of the security product spectrum where they do not have to worry about getting obsolete tomorrow just because the world of ‘attacks’ has changed into the next type of security exploits.