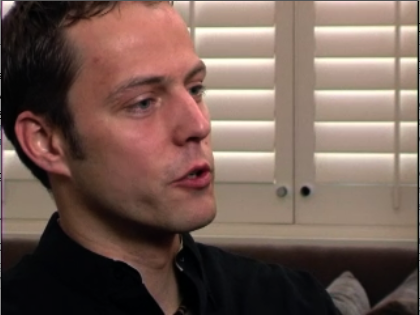
OnSecrity just released another video of the conversation we recorded last year during RSA. I am talking about security visualization in light of the book I am working on. This video cast is the sequel to the first one that I posted a few days ago.
 One of the topics I am discussing in the video is the “false dichotomy” between security and visualization. This is a topic that I talked about during a talk at the MIT Lincoln Labs at the beginning of December. The presentation showed how there are really two disciplines that come together in security visualization: Security and Visualization. The problem with this is that visualization people don’t know much about security and the other way around. It’s a very interesting topic to explore and it explains some of the mistakes that are being made with visualization tools and is also reflected in visualization research.
[tags]visualization, security, videocast[/tags]

You did a great job discussing the topic on visualization and security, but next time slow down your speech for giving out the web addresses. That’s my only criticism. All the points you made about the future of visualization and the way presenting data more effectively, by using newer tools(with software), for graphing can certainly serve the greater good.
One idea that I, personally, have thought about developing has to do with better charts for doctors, since the data in the charts is often- black and white. Just think about all the greater implications for your medical history being illuminated through well designed charts of data for any condition or medication you may be on, which could save a lot of lives! What do you think? Have you heard of anyone else doing something like this?
I’ve been interested in effectively visualizing data for about 3 years now, since I was first introduced to Tuft through books and seminars.
Comment by Adam — March 29, 2008 @ 1:30 pm