
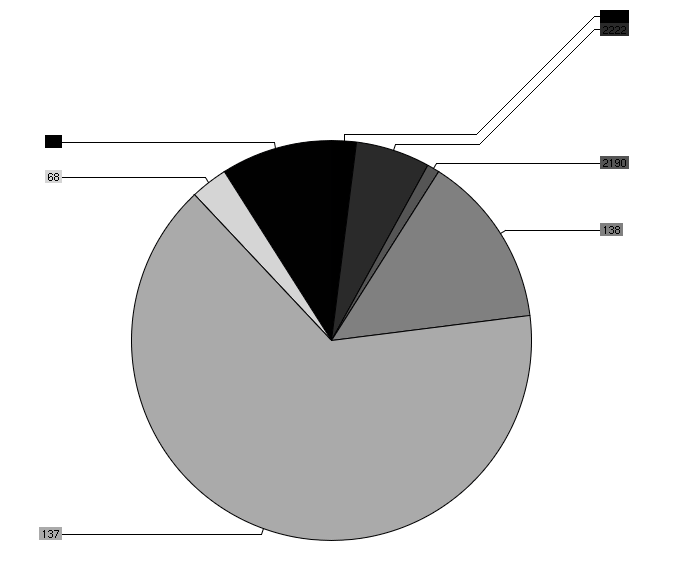
My R journey seems to be over… It’s just too complicated to get charts and plots right with R. I found a new library that I staerted playing with: chart director. I am using Perl to drive the graph generation and it’s actually fairly easy to use. There are some cumbersome pieces, such as seg-faults when you have NULL values in a matrix that you are drawing, but that’s things I can deal with ;
Here is a sample graph I generated: (I know, the color selection is fairly horrible!)
[tags]R, charts, visualization, perl[/tags]