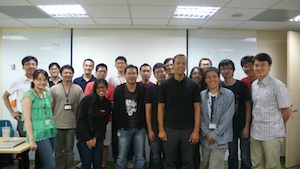
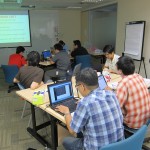
 I just returned from Taipei where I was teaching log analysis and visualization classes for Trend Micro. Three classes a 20 students. I am surprised that my voice is still okay after all that talking. It’s probably all the tea I was drinking.
The class schedule looked as follows:
Day 1: Log Analysis
- data sources
- data analysis and visualization linux (davix)
- log management and siem overview
- application logging guidelines
- log data processing
- loggly introduction
- splunk introduction
- data analysis with splunk
Day 2: Visualization
- visualization theory
- data visualization tools an libraries
- perimeter threat use-cases
- host-based data analysis in splunk
- packet capture analysis in splunk
- loggly api overview
- visualization resources
 The class was accompanied by a number of exercises that helped the students apply the theory we talked about. The exercises are partly pen and paper and partly hands-on data analysis of sample logs with the davix life CD.
I love Taipei, especially the food. I hope I’ll have a chance to visit again soon.
PS: If you are looking for a list of visualization resources, they got moved over to secviz.
