April 1, 2008
Thanks to the design department at Addison Wesley, I have a proposal for a cover page of my upcoming book:
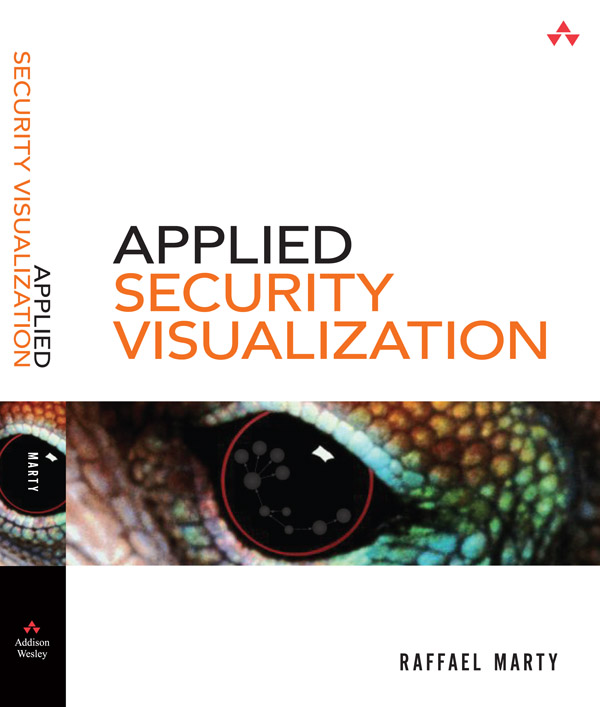
This is really exciting. I have been working on the book for over a year now and finally it seems that the end is in sight. I have three chapters completely done and they should appear in a rough-cuts program, as an electronic pre-version, very soon (next three weeks). Another three chapters I got back from my awesome review committee and then there are three chapters I still have to finish writing.
Applied Security Visualization should be available by Black Hat at the beginning of August. I will do anything I can to get it out by then.
[tags]applied security visualization, security visualization, visualization, security, applied[/tags]
March 7, 2008
 I will be at Source Boston next week, which is going to be probably one of the coolest conferences this year. The speaker lineup is absolutely fantastic. And I am not saying that because I am going to be speaking there. You can keep up with the conference on the Source Boston Blog or on the Twitter @SourceBoston feed.
My presentation carries the title: All the data that’s fit to visualize. Recognize this? It’s the New York Time’s headline. I am going to talk about what security visualization can learn from the NYT. I am very excited about the talk. I am going to try out some new presentation methods. Come and see it!
[ tags]security visualization, source boston, applied security visualization[/tags]
 A bunch of log analysis professionals started blogging on a new blog, located at: http://www.loganalysispros.com . Let’s see how much people actually are going to contribute there. I did my first post today about the new CEE Field List that was just posted on the CEE mailinglist. Here is where you can get more information about CEE and the newly posted field list.
January 24, 2008

OnSecrity just released another video of the conversation we recorded last year during RSA. I am talking about security visualization in light of the book I am working on. This video cast is the sequel to the first one that I posted a few days ago.
 One of the topics I am discussing in the video is the “false dichotomy” between security and visualization. This is a topic that I talked about during a talk at the MIT Lincoln Labs at the beginning of December. The presentation showed how there are really two disciplines that come together in security visualization: Security and Visualization. The problem with this is that visualization people don’t know much about security and the other way around. It’s a very interesting topic to explore and it explains some of the mistakes that are being made with visualization tools and is also reflected in visualization research.
[tags]visualization, security, videocast[/tags]
January 18, 2008
 It is pretty much exactly a year ago that I signed my contract with Addison Wesley to write a book about security data visualization. Now, a year later, I am getting really close. I am in the process of assembling my review committee and I a very excited about a couple of people that already accepted. Thanks in advance!
There is still a lot to be done. I have one more big chapter to write: “Perimeter Threat” and a couple to finish up. But I can see the end! It’s nice to see the end being close!
A little more than a month after I signed my contract with my publisher, they recorded a video cast with me. I am talking about security visualization and a little bit about the book. Beware, this was a year ago. It is interesting, however, that I would probably still say about the same things! This shows that the market has not really changed much. I hope this will change soon though!
December 19, 2007
I just had a moment of awe. I was playing around with packet captures and was wondering whether Wireshark would still ship with a command line alternative for the GUI version. I always liked Ethereal for its protocol analysis capabilities. I pretty quickly found out that the command line version was still maintained. Now called tshark. I was sort of shocked, when I realized how much protocol traffic was actually decoded:
~/tmp$ sudo tshark -ni en1

Capturing on en1

2.004403 192.168.0.12 -> 207.46.27.163 MSNMS USR 1 YYYYYYY@hotmail.com 1452999922.70216123.6471199

3.672270 205.188.8.233 -> 192.168.0.12 AIM Buddylist Offgoing Buddy: ZZZZZZZZZZ

3.673979 205.188.7.244 -> 192.168.0.12 AIM Buddylist Offgoing Buddy: ZZZZZZZZZZ

5.136301 207.46.27.163 -> 192.168.0.12 MSNMS [TCP Retransmission] USR 1 OK YYYYY@hotmail.com Raffael%20Marty

5.136735 192.168.0.12 -> 207.46.27.163 MSNMS CAL 2 XXXXXX@hotmail.com

5.174140 207.46.27.163 -> 192.168.0.12 MSNMS CAL 2 RINGING 1111111111

6.750004 207.46.27.163 -> 192.168.0.12 MSNMS JOI XXXXXXX@hotmail.com XXXX%20Buding%20in%20boston
It understands the IM protocols (above version is anonymized)! I wonder how I could exploit this for some interesting visualization.
December 10, 2007
 Today I found myself researching “moving average analysis” techniques. Using moving average analysis can be fairly useful in trending risk. Plot the moving average over your risk and compare it with the actual risk numbers, much like you would analyze a stock chart. I will write more extensively about this in my book in the “Visual Security Analysis” chapter.
What I just learned and what really pointed me to write this blog post is that Excel has a data analysis add-in that lets you compute moving averages. In my Excel instance, I had to first enable the “Data Analysis” add-in by going to Tools|Add-Ins… Once enabled, I got a new menu item under Tools which is Data Analysis… There you can choose from a variety of data analysis tools, among them a moving average calculator. This blog post shows exactly to to apply the add-in.
December 7, 2007
 Finally, Common Event Expression (CEE) has its Web site up!
We are working on a few initiatives right now. If you want to contribute to the discussion, join the mailing list. Send an email to cee@mitre.org to subscribe.
November 14, 2007
 No news anymore, but still worth a blog entry. Michael Rash wrote a new book on firewalls. His approach is not the traditional one where he looks into firewalls themselves. He explores all kinds of additional tools tat can be used alongside of firewalls to tune them and make them more efficient. I have read part of his book before he published it and I really liked what he was up to. I think the final copy should be on my desk by now. Can’t wait to read it. Here is a link to his Web page:
http://www.cipherdyne.org/blog/2007/09/online-site-for-linux-firewalls-attack-detection-and-response.html
October 15, 2007
 I was playing with database audit logs for a bit to try and visualize some aspects of them. While doing so, I came across a pretty interesting problem. The audit logs contain entries that indicate what exact SQL query was executed. Now, I am not interested in the entire query, but I need to know which tables were touched. I was trying to build some regular expressions to extract that information from the query, but I gave up pretty quickly. It’s just too complicated for a regex. I was wondering whether there is a way to take a SQL query, for example:
select * from a.table1 a, b.tabl2 b join c.table3 on b.id1=c.id2 where a.foo='bar'
and extract all the table names: a.table1, b.table2, c.table3. Are there tools to do that? Remember, I don’t have the database with these tables. I only have a log from some database. The script should support all the SQL perks like joins, nested selects, etc. Anyone have a good way to do this?