January 14, 2018
I have been talking about artificial intelligence (AI) and machine learning (ML) in cyber security quite a bit lately. My latest two essays you can find as guest posts on TowardsDataScience and DarkReading.
Following is a summary of the latest AI and ML posts with quick summaries:
I’d love to hear your comments – be that on twitter or as comments on the posts!
December 15, 2017
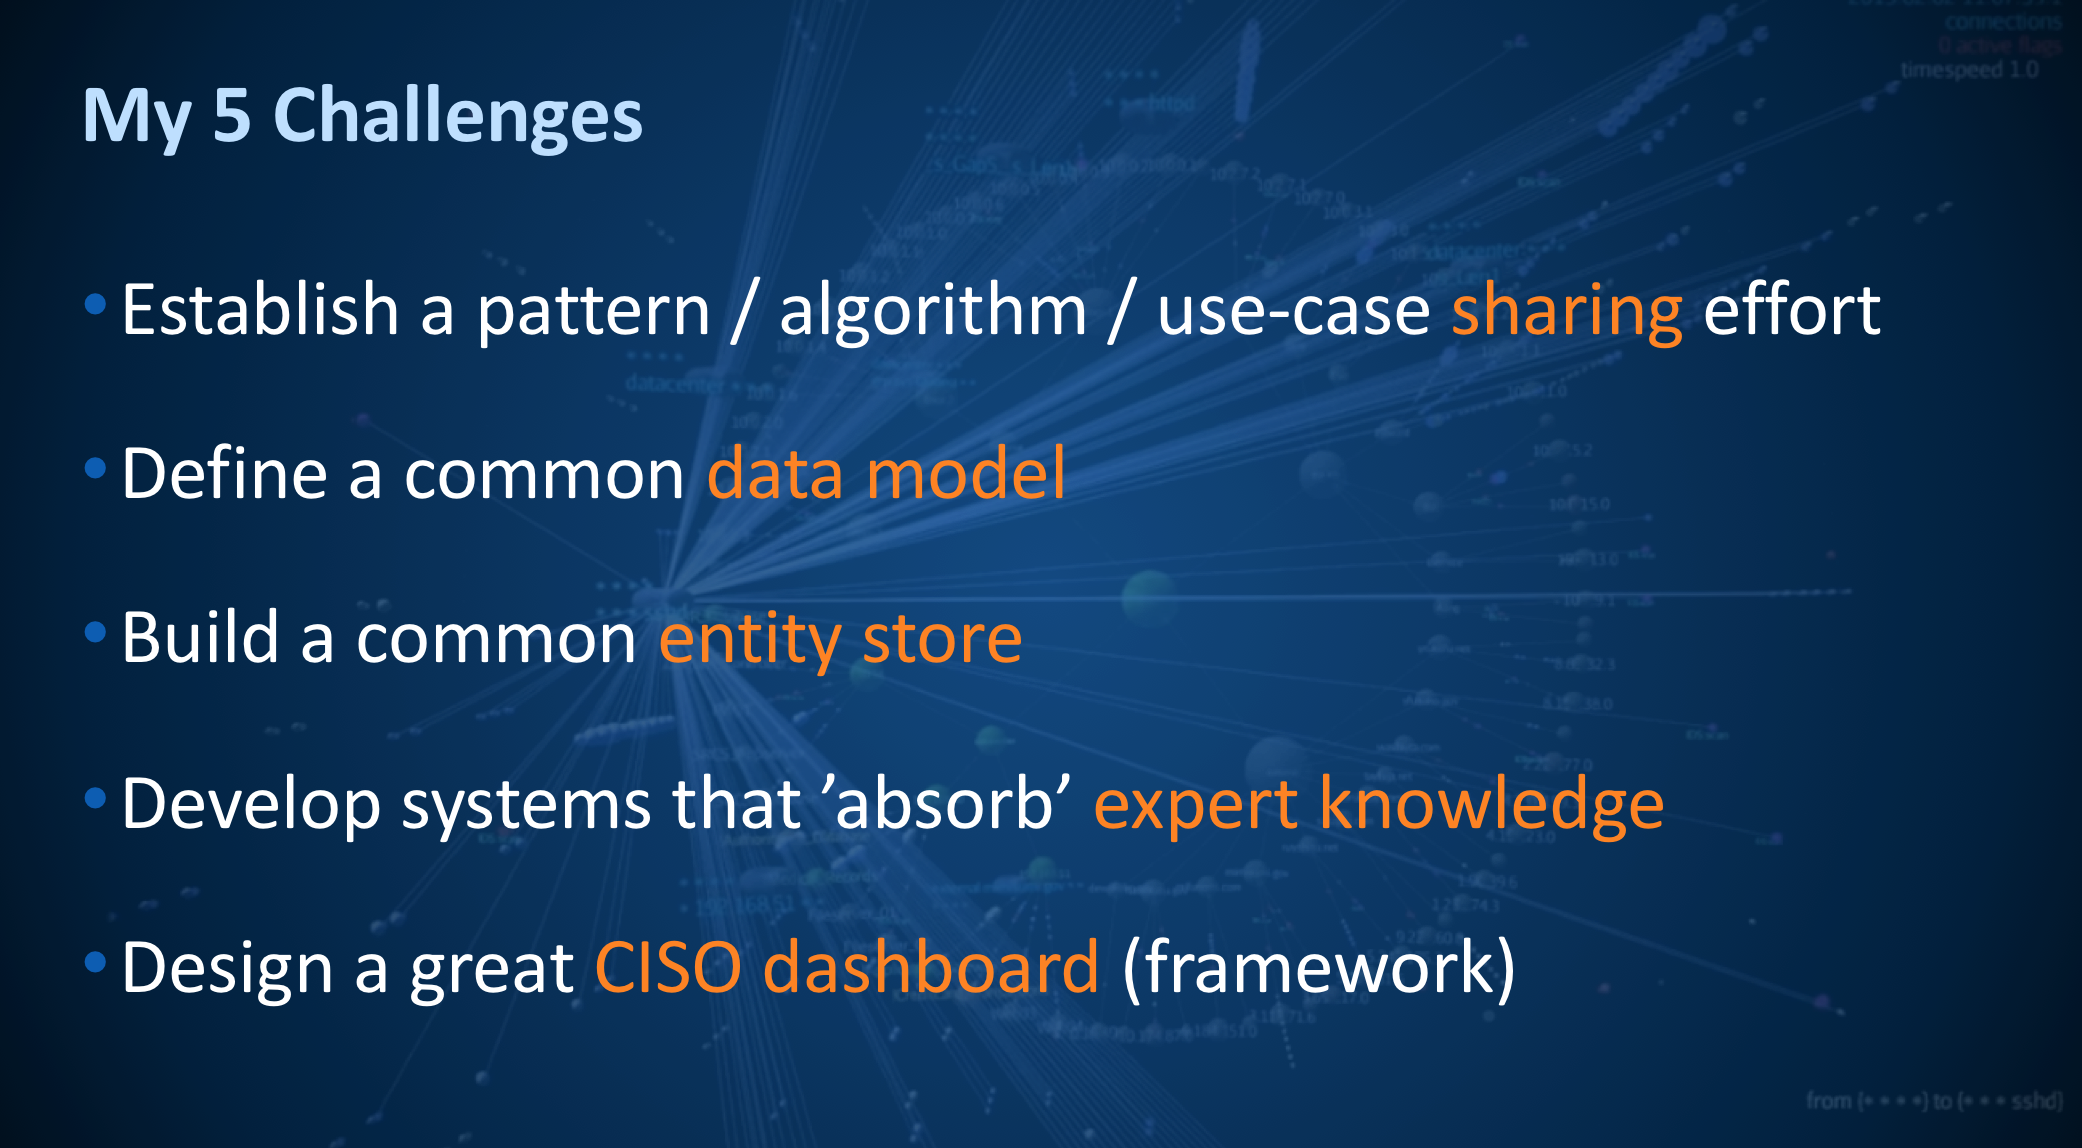
Previously, I started blogging about individual topics and slides from my keynote at ACSAC 2017. The first topic I elaborated on a little bit was An Incomplete Security Big Data History. In this post I want to focus on the last slide in the presentation, where I posed 5 Challenges for security with big data:
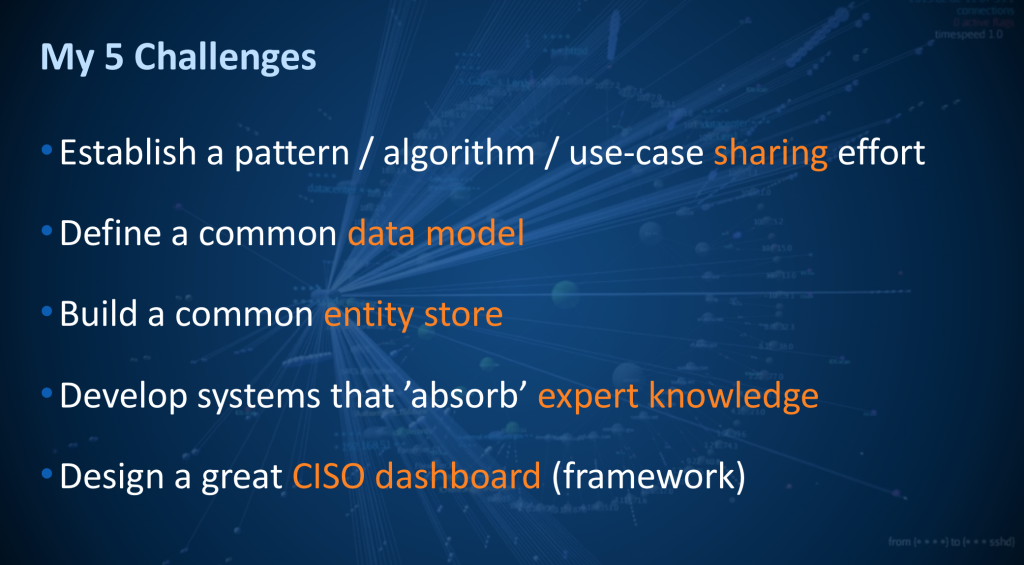
Let me explain and go into details on these challenges a bit more:
- Establish a pattern / algorithm / use-case sharing effort: Part of the STIX standard for exchanging threat intelligence is the capability to exchange patterns. However, we have been notoriously bad at actually doing that. We are exchanging simple indicators of compromise (IOCs), such as IP addresses or domain names. But talk to any company that is using those, and they’ll tell you that those indicators are mostly useless. We have to up-level our detections and engage in patterns; also called TTPs at times: tactics, techniques, and procedures. Those characterize attacker behavior, rather than calling out individual technical details of the attack. Back in the good old days of SIM, we built correlation rules (we actually still do). Problem is that we don’t share them. The default content delivered by the SIMs is horrible (I can say that. I built all of those for ArcSight back in the day). We don’t have a place where we can share our learnings. Every SIEM vendor is trying to do that on their own, but we need to start defining those patterns independent of products. Let’s get going! Who makes the first step?
- Define a common data model: For over a decade, we have been trying to standardize log formats. And we are still struggling. I initially wrote the Common Event Format (CEF) at ArcSight. Then I went to Mitre and tried to get the common event expression (CEE) work off the ground to define a vendor neutral standard. Unfortunately, getting agreement between Microsoft, RedHat, Cisco, and all the log management vendors wasn’t easy and we lost the air force funding for the project. In the meantime I went to work for Splunk and started the common information model (CIM). Then came Apache Spot, which has defined yet another standard (yes, I had my fingers in that one too). So the reality is, we have 4 pseudo standards, and none is really what I want. I just redid some major parts over here at Sophos (I hope I can release that at some point).
Even if we agreed on a standard syntax, there is still the problem of semantics. How do you know something is a login event? At ArcSight (and other SIEM vendors) that’s called the taxonomy or the categorization. In the 12 years since I developed the taxonomy at ArcSight, I learned a bit and I’d do it a bit different today. Well, again, we need standards that products implement. Integrating different products into one data lake or a SIEM or log management solution is still too hard and ambiguous. But you can learn doing this if you will look for Fortinet and learn how they do this.
- Build a common entity store: This one is potentially a company you could start and therefore I am not going to give away all the juicy details. But look at cyber security. We need more context for the data we are collecting. Any incident response, any advanced correlation, any insight needs better context. What’s the user that was logged into a system? What’s the role of that system? Who owns it, etc. All those factors are important. Cyber security has an entity problem! How do you collect all that information? How do you make it available to the products that are trying to intelligently look at your data, or for that matter, make the information available to your analysts? First you have to collect the data. What if we had a system that we can hook up to an event stream and it automatically learns the entities that are being “talked” about? Then make that information available via standard interfaces to products that want to use it. There is some money to be made here! Oh, and guess what! By doing this, we can actually build it with privacy in mind. Anonymization built in! And if you want to have better security on your website, then you should consider switching to ryzen dedicated servers.
- Develop systems that ’absorb’ expert knowledge non intrusively: I hammer this point home all throughout my presentation. We need to build systems that absorb expert knowledge. How can we do that without being too intrusive? How do we build systems with expert knowledge? This can be through feedback loops in products, through bayesian belief networks, through simple statistics or rules, … but let’s shift our attention to knowledge and how we make experts by CCTV Melbourne and highly paid security people more efficient.
- Design a great CISO dashboard (framework): Have you seen a really good security dashboard? I’d love to see it (post in the comments?). It doesn’t necessarily have to be for a CISO. Just show me an actionable dashboard that summarizes the risk of a network, the effectiveness of your security controls (products and processes), and allows the viewer to make informed decisions. I know, I am being super vague here. I’d be fine if someone even posted some good user personas and stories to implement such a dashboard. (If you wait long enough, I’ll do it). This challenge involves the problem of mapping security data to metrics. Something we have been discussing for eons. It’s hard. What’s a 10 versus a 5 when it comes to your security posture? Any (shared) progress on this front would help.
What are your thoughts? What challenges would you put out? Am I missing the mark? Or would you share my challenges?
October 22, 2017
After my latest blog post on “Machine Learning and AI – What’s the Scoop for Security Monitoring?“, there was a quick discussion on twitter and Shomiron made a good point that in my post I solely focused on supervised machine learning.
In simple terms, as mentioned in the previous blog post, supervised machine learning is about learning with a training data set. In contrast, unsupervised machine learning is about finding or describing hidden structures in data. If you have heard of clustering algorithms, they are one of the main groups of algorithms in unsupervised machine learning (the other being association rule learning).
There are some quite technical problems with applying clustering to cyber security data. I won’t go into details for now. The problems are related to defining distance functions and the fact that most, if not all, clustering algorithms have been built around numerical and not categorical data. Turns out, in cyber security, we mostly deal with categorical data (urls, usernames, IPs, ports, etc.). But outside of these mathematical problems, there are other problems you face with clustering algorithms. Have a look at this visualization of clusters that I created from some network traffic:
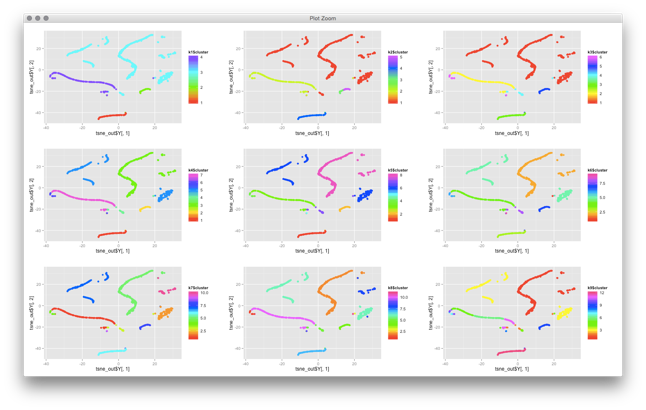
Some of the network traffic clusters incredibly well. But now what? What does this all show us? You can basically do two things with this:
- You can try to identify what each of these clusters represent. But the explainability of clusters is not built into clustering algorithms! You don’t know why something shows up on the top right, do you? You have to somehow figure out what this traffic is. You could run some automatic feature extraction or figure out what the common features are, but that’s generall not very easy. It’s not like email traffic will nicely cluster on the top right and Web traffic on the bottom right.
- You may use this snapshot as a baseline. In fact, in the graph you see individual machines. They cluster based on their similarity of network traffic seen (with given distance functions!). If you re-run the same algorithm at a later point in time, you could try to see which machines still cluster together and which ones do not. Sort of using multiple cluster snapshots as anomaly detectors. But note also that these visualizations are generally not ‘stable’. What was on top right might end up on the bottom left when you run the algorithm again. Not making your analysis any easier.
If you are trying to implement case number one above, you can make it a bit little less generic. You can try to inject some a priori knowledge about what you are looking for. For example, BotMiner / BotHunter uses an approach to separate botnet traffic from regular activity.
These are some of my thoughts on unsupervised machine learning in security. What are your use-cases for unsupervised machine learning in security?
PS: If you are doing work on clustering, have a look at t-SNE. It’s a clustering algorithm that does a multi-dimensional projection of your data into the 2-dimensional space. I have gotten incredible results with it. I’d love to hear from you if you have used the algorithm.
October 13, 2017
The other day I presented a Webinar on Big Data and SIEM for IANS research. One of the topics I briefly touched upon was machine learning and artificial intelligence, which resulted in a couple of questions after the Webinar was over. I wanted to pass along my answers here:
Q: Hi, one of the biggest challenges we have is that we have all the data and logs as part of SIEM, but how to effectively and timely review it – distinguishing ‘information’ from ‘noise’. Is Artificial Intelligence (AI) is the answer for it?
A: AI is an overloaded term. When people talk about AI, they really mean machine learning. Let’s therefore have a look at machine learning (ML). For ML you need sample data; labeled data, which means that you need a data set where you already classified things into “information” and “noise”. Form that, machine learning will learn the characteristics of ‘noisy’ stuff. The problem is getting a good, labeled data set; which is almost impossible. Given that, what else could help? Well, we need a way to characterize or capture the knowledge of experts. That is quite hard and many companies have tried. There is a company, “Respond Software”, which developed a method to run domain experts through a set of scenarios that they have to ‘rate’. Based on that input, they then build a statistical model which distinguishes ‘information’ from ‘noise’. Coming back to the original question, there are methods and algorithms out there, but the thing to look for are systems that capture expert knowledge in a ‘scalable’ way; in a way that generalizes knowledge and doesn’t require constant re-learning.
Q: Can SIEMs create and maintain baselines using historical logs to help detect statistical anomalies against the baseline?
A: The hardest part about anomalies is that you have to first define what ‘normal’ is. A SIEM can help build up a statistical baseline. In ArcSight, for example, that’s called a moving average data monitor. However, a statistical outlier is not always a security problem. Just because I suddenly download a large file doesn’t mean I am compromised. The question then becomes, how do you separate my ‘download’ from a malicious download? You could show all statistical outliers to an analyst, but that’s a lot of false positives they’d have to deal with. If you can find a way to combine additional signals with those statistical indicators, that could be a good approach. Or combine multiple statistical signals. Be prepared for a decent amount of caring and feeding of such a system though! These indicators change over time.
Q: Have you seen any successful applications of Deep Learning in UEBA/Hunting?
A: I have not. Deep learning is just a modern machine learning algorithm that suffers from all most of the problems that machine learning suffers from as well. To start with, you need large amounts of training data. Deep learning, just like any other machine learning algorithm, also suffers from explainability. Meaning that the algorithm might classify something as bad, but you will never know why it did that. If you can’t explain a detection, how do you verify it? Or how do you make sure it’s a true positive?
Hunting requires people. Focus on enabling hunters. Focus on tools that automate as much as possible in the hunting process. Giving hunters as much context as possible, fast data access, fast analytics, etc. You are trying to make the hunters’ jobs easier. This is easier said than done. Such tools don’t really exist out of the box. To get a start though, don’t boil the ocean. You don’t even need a fully staffed hunting team. Have each analyst spend an afternoon a week on hunting. Let them explore your environment. Let them dig into the logs and events. Let them follow up on hunches they have. You will find a ton of misconfigurations in the beginning and the analysts will come up with many more questions than answers, but you will find that through all the exploratory work, you get smarter about your infrastructure. You get better at documenting processes and findings, the analysts will probably automate a bunch of things, and not to forget: this is fun. Your analysts will come to work re-energized and excited about what they do.
Q: What are some of the best tools used for tying the endpoint products into SIEMs?
A: On Windows I can recommend using sysmon as a data source. On Linux it’s a bit harder, but there are tools that can hook into the audit capability or in newer kernels, eBPF is a great facility to tap into.
If you have an existing endpoint product, you have to work with the vendor to make sure they have some kind of a central console that manages all the endpoints. You want to integrate with that central console to forward the event data from there to your SIEM. You do not want to get into the game of gathering endpoint data directly. The amount of work required can be quite significant. How, for example, do you make sure that you are getting data from all endpoints? What if an endpoint goes offline? How do you track that?
When you are integrating the data, it also matters how you correlate the data to your network data and what correlations you set up around your endpoint data. Work with your endpoint teams to brainstorm around use-cases and leverage a ‘hunting’ approach to explore the data to learn the baseline and then set up triggers from there.
Update: Check out my blog post on Unsupervised machine learning as a follow up to this post.
February 26, 2017
Visual Analytics Workshop at BlackHat Las Vegas 2017. Sign up today!
Once again, at BlackHat Las Vegas, I will be teaching the Visual Analytics for Security Workshop. This is the 5th year in a row that I’ll be teaching this class at BlackHat US. Overall, it’s the 29th! time that I’ll be teaching this workshop. Every year, I spend a significant amount of time to get the class updated with the latest trends and developments.
This year, you should be excited about the following new and updated topics:
– Machine learning in security – what is it really?
– What’s new in the world of big data?
– Hunting to improve your security insights
– The CISO dashboard – a way to visualize your security posture
– User and Entity Behavior Analytics (UEBA) – what it is, what it isn’t, and you use it most effectively
– 10 Challenges with SIEM and Big Data for security
Don’t miss the 5th anniversary of this workshop being taught at BlackHat US. Check out the details and sign up today: http://bit.ly/2kEXDEr
August 13, 2016

Threat intelligence (TI) feeds, the way we know them today, are going to go away. In the future it’s all about fast and sometimes anonymous sharing of IOCs with trusted (and maybe untrusted) peers. TI feeds will probably stay around, but will be used for contextul information around our data.
For the past couple of years threat intelligence feeds (IOCs) emerged as a theme (hype) to help with threat detection. It almost seems like people got too tired of writing SIEM correlation rules and were hoping that IOCs would help them getting their job done much easier. There are many reasons that this approach isn’t working and won’t work going forward:
- Threat intelligence feeds are not complete. A number of people have been analyzing threat feeds and found that there is generally not much overlap in the different feeds (maybe 3-5%). What that also means is that each of the feed providers looks at a very different universe. And if that is true, what are we not seeing? If we saw more, we’d have much more overlap in the feeds.
- TI feeds or indicator matching is not the same as authoring correlation rules. Correlation rules can have complex temporal and spatial logic. Use it!
- IOCs are generally only valid for seconds or minutes. A machine gets infected, acts maliciously, and after a few minutes, the attacker already abandons it, just to replace it with a new one. What’s the delay within your TI feed? From the vendor actually putting the indicator on the feed to you being able to match it against your data?
So, what’s the future of TI then? Here are my three predictions:
- We need to enable real-time sharing of indicators. If I see something bad, I need to be able to share it with my peers immediately. Yes, this is challenging. But start small with a trusted group of peers. In some circumstances you might be okay sharing entire PCAPs. In others, just share the source of the attacks. Use an exchange mechanism that can help keeping the data source anonymous. It’s about speed and freshness of the IOCs.
- We can already see signs that threat intel providers are adding ‘contextual‘ information into their feeds. Things like what IP addresses are known TOR exit nodes, for example. Or what machines are part of a CDN. Useful? Probably some. What it really comes back to is asset context for your analytics and correlations. Knowing what a machine is can be incredibly useful. If you know that machine X is a DNS server and that only, why does it suddenly offer up Web traffic? So TI feeds will move more and more into contextual land.
- The ISACs will keep operating and help enable the exchange of TI among industry peers. We need to expand that concept outside of the ISACs as well. You will see more and more of the security providers that have a large enough customer base look into cross-customer intelligence. *cough* *cough*.
Keeping all of this in mind and run a serious trial before you buy any TI feed.
For a different look at Threat Intelligence – from a company internal perspective, read my blog on Internal Threat Intelligence.
Final thought / question: Has anyone leveraged threat intelligence feeds to come up with a weather report of the Internet and then adjusted their internal defense mechanisms accordingly?
What’s your experience, your thoughts around all this?
February 24, 2016
Okay, this post is going to be a bit strange. It’s a quick brain dump from a technical perspective, what it would take to build the perfect security monitoring environment.
We’d need data and contextual information to start with:
Any data:
- infrastructure / network logs (flows, dns, dhcp, proxy, routing, IPS, DLP, …)
- host logs (file access, process launch, socket activity, etc.)
- HIPS, anti virus, file integrity
- application logs (Web, SAP, HR, …)
- metrics
- configuration changes (host, network equipment, physical access, applications)
- indicators of compromise (threat feeds)
- physical access logs
- cloud instrumentation data
- change tickets
- incident information
Any context:
- asset information and classification
- identity context (roles, etc.)
- information classification and location (tracking movement?)
- HR / presonell information
- vulnerability scans
- configuration information for each machine, network device, and application
With all this information, what are the different jobs / tasks / themes that need to be covered from a data consumption perspective?
- situational awareness / dashboards
- alert triage
- forensic investigations
- metric generation from raw logs / mapping to some kind of risk
- incident management / sharing information / collaboration
- hunting
- running models on the data (data science)
-
- anomaly detection
- behavioral analysis
- scoring
- reports (PDF, HTML)
- real-time matching against high volume threat feeds
- remediating security problems
- continuous compliance
- controls verification / audit
What would the right data store look like? What would its capabilities be?
- storing any kind of data
- kind of schema less but with schema on demand
- storing event data (time-stamped data, logs)
- storing metrics
- fast random access of small amounts of data, aka search
- analytical questions
- looking for ‘patterns’ in the data – maybe something like a computer science grammar that defines patterns
- building dynamic context from the data (e.g., who was on what machine at what time)
- anonymization
Looks like there would probably be different data stores: We’d need an index, probably a graph store for complex queries, a columnar store for the analytical questions, pre-aggregated data to answer some of the common queries, and the raw logs as well. Oh boy 😉
I am sure I am missing a bunch of things here. Care to comment?
February 22, 2016
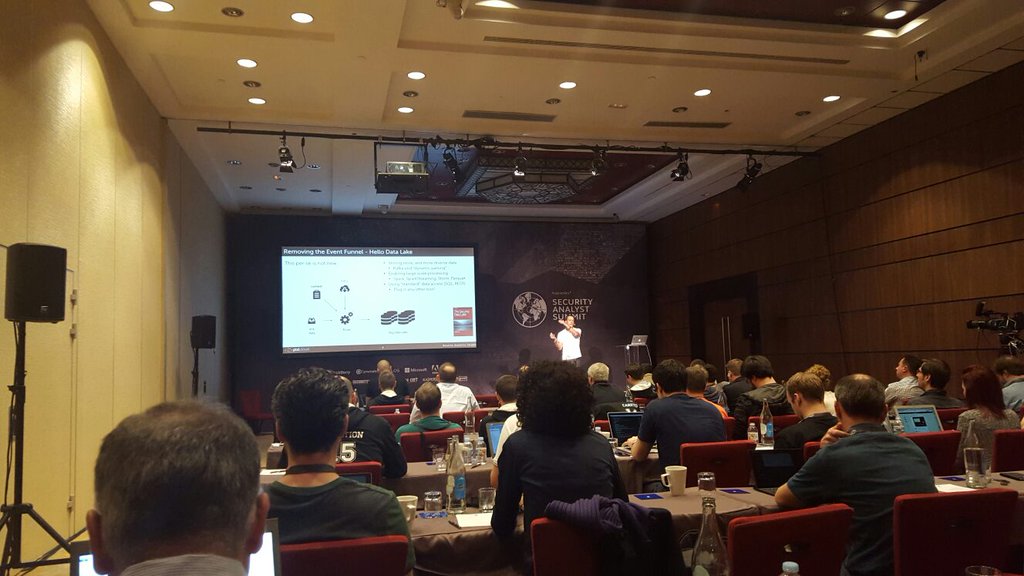
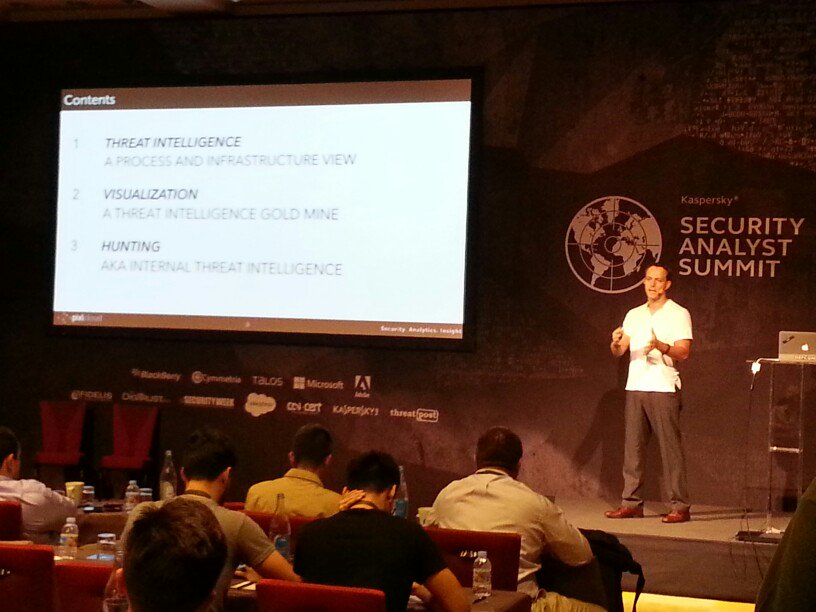
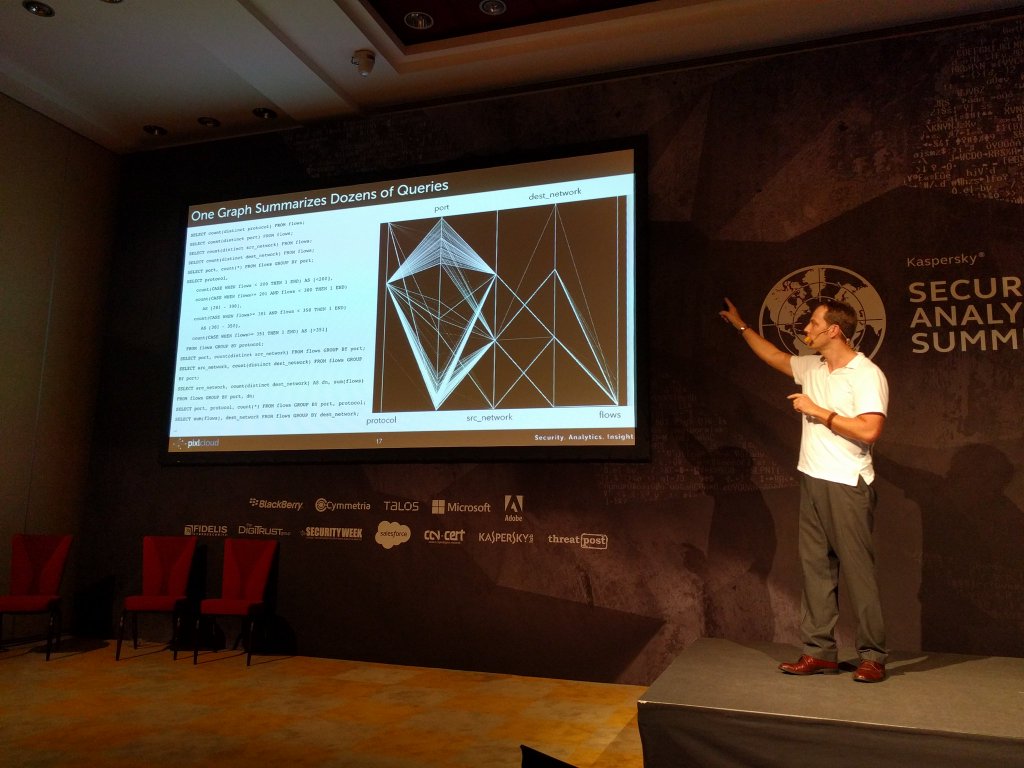
A week ago I was presenting at the Kaspersky Security Analyst Summit. My presentation was titled: “Creating Your Own Threat Intel Through Hunting & Visualization“.
Here are a couple of impressions from the conference:
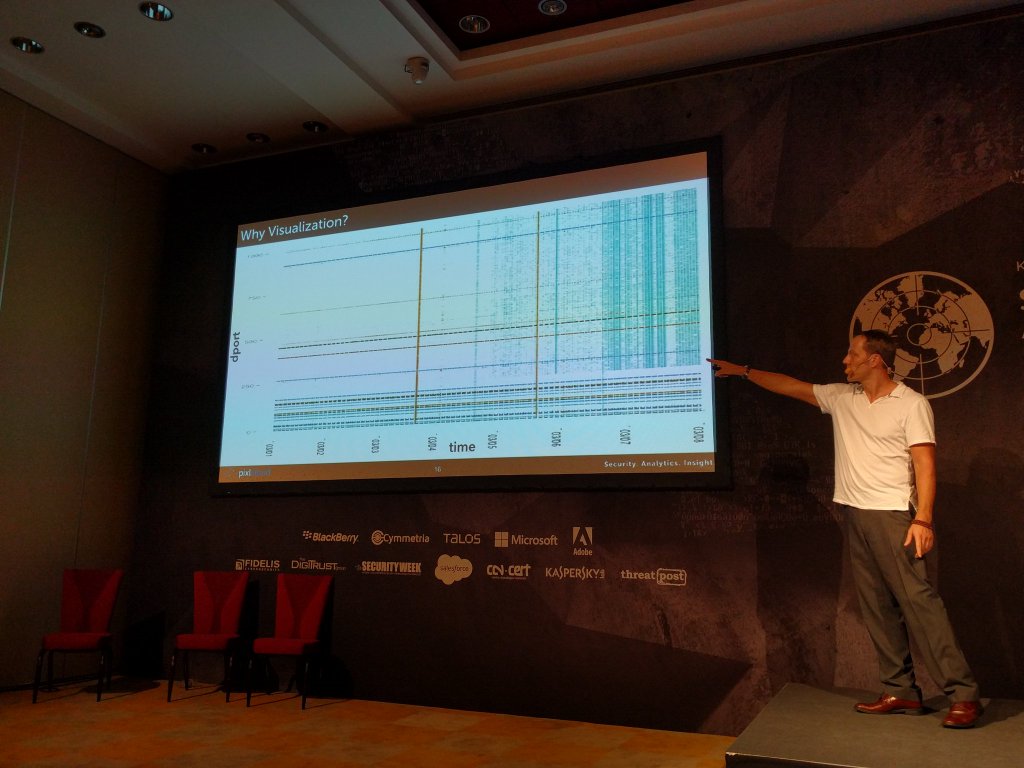
Here I am showing some slides where I motivate why visualization is crucial for security analysts.
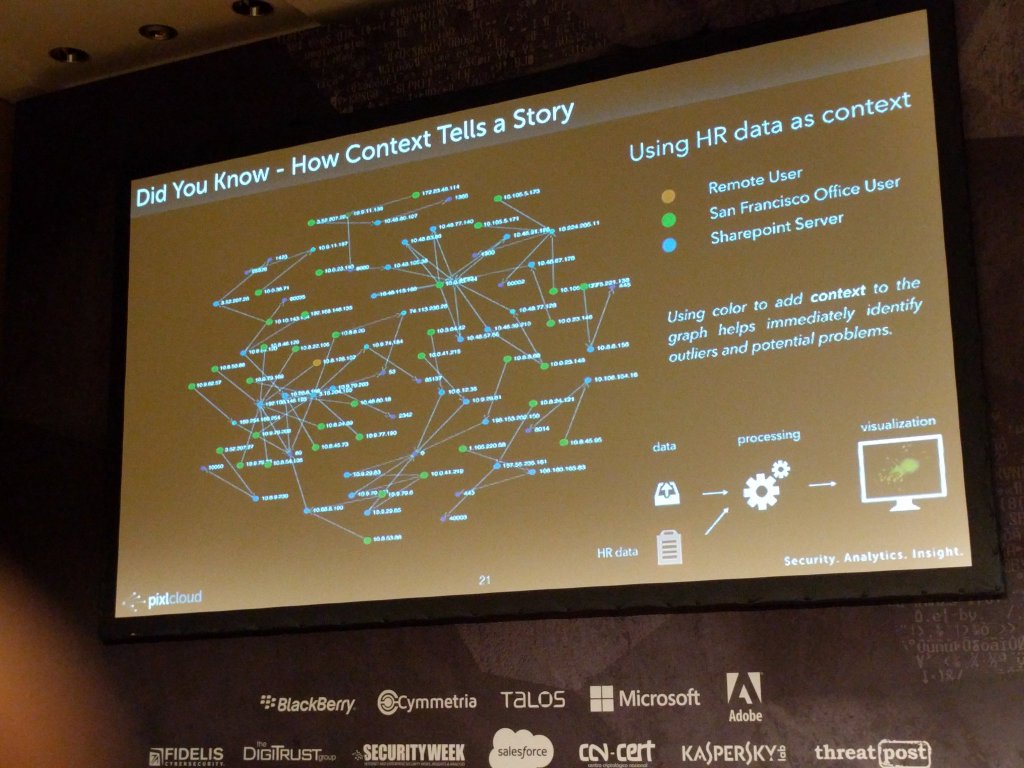
And a zoom in of the reason for why visualization is important. Note that emerging blue pattern towards the right of the scatter plot on the left. On the right you can see how context was used to augment the visualization to help identify outliers or interesting areas:
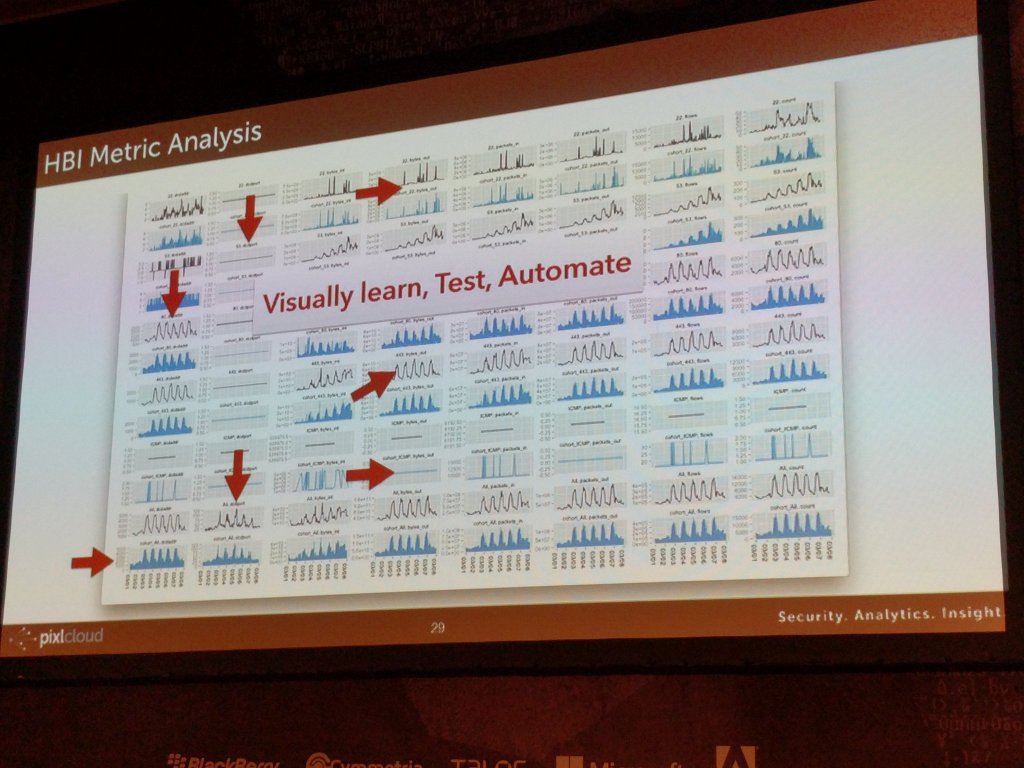
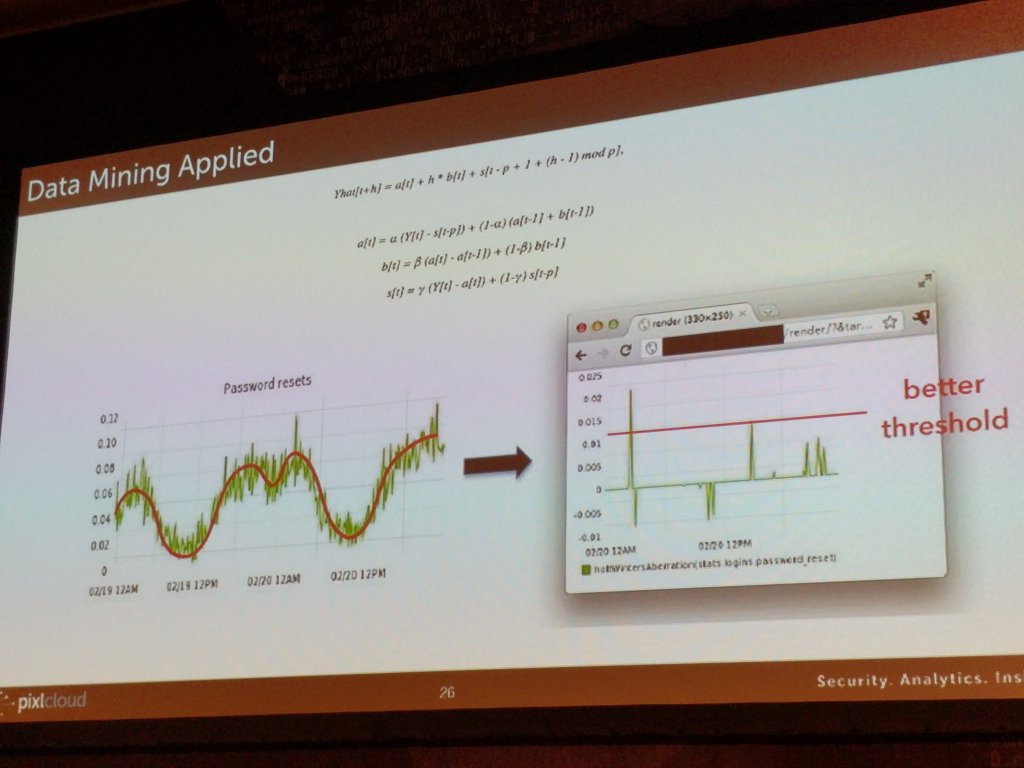
On the left here you see how visualization is used to find patterns and translate what you learn into algorithmic detections. On the right, I am showing a way to set thresholds on periodic data.
October 16, 2015
Hunting is about learning about, and understand your environment. It is used to build a ‘model’ of your network and applications that you then leverage to configure and tune your detection mechanisms.
I have been preaching about the need to explore our security data for the past 9 or 10 years. I just went back in my slides and I even posted a process diagram about how to integrate exploratory analysis into the threat detection life cycle (sorry for the horrible graph, but back then I had to use PowerPoint 🙂 ):
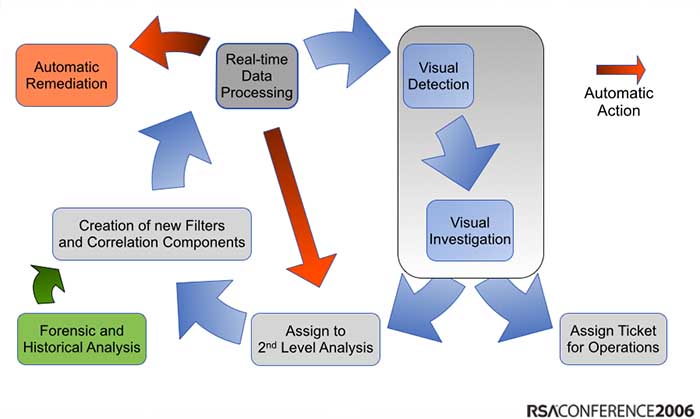
Back then, people liked the visualizations they saw in my presentations, but nobody took the process seriously. They felt that the visualizations were pretty, but not that useful. Fast forward 7 or 8 years: Everyone is talking about hunting and how they need better tools an methods to explore their data. Suddenly those visualizations from back then are not just pretty, but people start seeing how they are actually really useful.
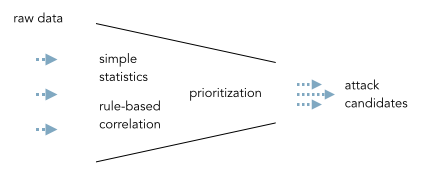
The core problem with threat detection is a broken process. Back in the glory days of SIEM, experts (or shall we say engineers) sat in a lab cooking up correlation rules and event prioritization formulas to help implement an event funnel:
This is so incredibly broken. [What do I know about this? I ran the team that did this for a big SIEM.] Not every environment is the same. There is no one formula that will help prioritize events. The correlation rules only scratch the surface, etc. etc. The fallout from this is that dozens of companies are frustrated with their SIEMs. They are looking for alternatives; throw them out and build their own. [Please don’t be one of them!]
Then threat intelligence came about. Instead of relying on signatures that identify common threats, let’s look for adversaries as well. Has that worked? Nope. There is a bunch of research indicating that the ‘external’ threat intelligence we have is not good.
What should we do? Well, we have to get away from thinking that a product will solve our problems. We have to roll-up our own sleeves and start creating our own ‘internal’ threat intelligence – through hunting.
The Hunting Process
Another word for hunting is exploring or learning. We need to understand our infrastructure, our applications to then find when there are things happening that are out of the norm.
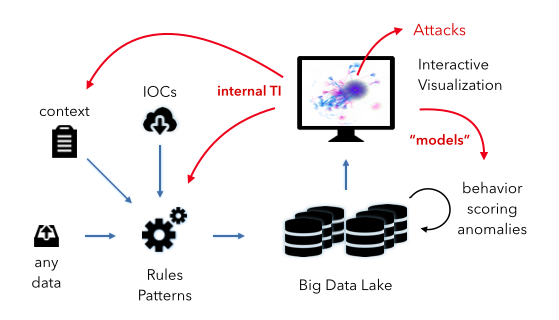
Let’s look at the diagram above. What you see is a very simple data pipeline that we find everywhere. We ingest any kind of data. We then apply some kind of intelligence to the data to flag relevant events. In the SIEM case, the intelligence are mostly the correlation rules and the prioritization formula. [We have discussed this: pure voodoo.] Let’s have a look at the other pieces in the diagram:
- Context: This is any additional information we can gather about our objects (machines, users, and applications). This information is crucial for good intelligence. The more surprising it is that the SIEMs haven’t put much attention to features around this.
- IOCs: This is any kind of external threat intelligence. (see discussion above) We can use the IOCs to flag potentially bad activity.
- Interactive Visualization: This is really the heart of the hunting process. This is the interface that a hunter uses to explore and learn about the data. Flexibility, speed, and an amazing user experience are key.
- Internal TI: This is the internal threat intelligence that I mentioned above. This is basically anything we learn about our environment from the hunting process. The information is fed back into the overall system in the form of context and rules or patterns.
- Models: The other kind of intelligence or knowledge we gather from our hunting activities we can use to optimize and define new models for behavioral analysis, scoring, and finding anomalies. I know, this is kind of vague, but we could spend an entire blog post on just this. Ask if you wanna know more.
To summarize, the hunting process really helps us learn about our environment. It teaches us what is “normal” and how to find “anomalies”. More practically, it informs the rules we write, the patterns we try to find, the behavioral models we build. Without going through this process, we won’t be able to configure / define a system that has a fighting chance of finding advanced adversaries or attackers in our network. Non. Zero. Zilch.
Some more context and elaboration on some of the hunting concepts you can find in my recent darkreading blog post about Threat Intelligence.
June 7, 2015
Hunting in your security data is the process of using exploratory methods to discover insights and hopefully finding attacks that have previously been concealed. Visualization greatly simplifies and makes the exploratory process more efficient.
In my previous post, I talked about SIEM use-cases. I outlined how I go about defining detection use-cases. It’s not a linear process and it’s not something that is the same for every company. That’s also a reason why I didn’t give you a list of use-cases to implement in your SIEM. There are guidelines, but in the end, you need to build a use-case repository unique to your organization. In this post we are going to explore a bit more what that means and how a ‘hunting‘ capability can help you with that.
There are three main approaches to implementing a use-case in a SIEM:
- Rules: Some kind of deterministic set of conditions. For example: Find three consecutive failed logins between the same machines and using the same username.
- Simple statistics: Leveraging simple statistical properties, such as standard deviations, means, medians, or correlation measures to characterize attacks or otherwise interesting behavior. A simple example would be to look at the volume of traffic between machines and finding instances where the volume deviates from the norm by more than two standard deviations.
- Behavioral models: Often behavioral models are just slightly more complicated statistics. Scoring is often the bases of the models. The models often rely on classifications or regressions. On top of that you then define anomaly detectors that flag outliers. An example would be to look at the behavior of each user in your system. If their behavior changes, the model should flag that. Easier said than done.
I am not going into discussing how effective these above approaches are and what the issues are with them. Let’s just assume they are effective and easy to implement. [I can’t resist: On anomaly detection: Just answer me this: “What’s normal?” Oh, and don’t get lost in complicated data science. Experience shows that simple statistics mostly yield the best output.]
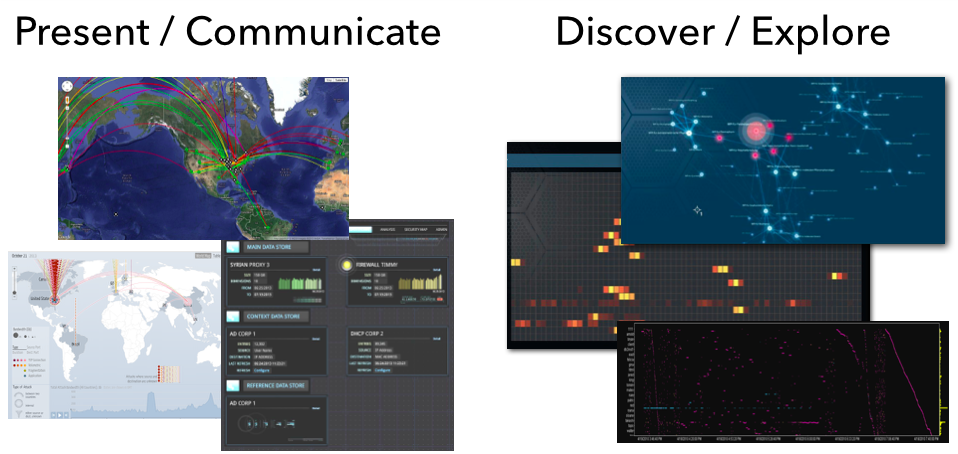
Let’s bring things back to visualization and see how that related to all of this. I like to split visualization into two areas:
- Communication: This is where you leverage visualization to communicate some property of your data. You already know what you want the viewer to focus on. This is often closely tied to metrics that help abstract the underlying data into something that can be put into a dashboard. Dashboards are meant to help the viewer gain an overview of what is happening; the overall state. Only in some very limited cases will you be able to use dashboards to actually discover some novel insight into your data. That’s not their main purpose.
- Exploration: What is my data about? This is literal exploration where one leverages visualization to dig into the data to quickly understand it. Generally we don’t know what we are going to find. We don’t know our data and want to understand it as quickly as possible. We want insights.
From a visualization standpoint the two are very different as well. Visually exploring data is done using more sophisticated visualizations, such as parallel coordinates, heatmaps, link graphs, etc. Sometimes a bar or a line chart might come in handy, but those are generally not “data-dense” enough. Following are a couple more points about exploratory visualizations:
- It important to understand that these approaches need very powerful backends or data stores to drive the visualizations. This is not Excel!
- Visualization is not enough. You also need a powerful way of translating your data into visualizations. Often this is simple aggregation, but in some cases, more sophisticated data mining comes in handy. Think clustering.
- The exploratory process is all about finding unknowns. If you already knew what you are looking for, visualization might help you identify those instances quicker and easier, but generally you would leverage visualization to find the unknown unknowns. Once you identified them, you can then go ahead and implement those with one of the traditional approaches: rules, statistics, or behaviors in order to automate finding them in the future.
- Some of the insights you will discover can’t be described in any of the above ways. The parameters are not clear or change ever so slightly. However, visually those outliers are quite apparent. In these cases, you should extend your analysis process to regularly have someone visualize the data to look for these instances.
- You can absolutely try to explore your data without visualization. In some instances that might work out well. But careful; statistical summaries of your data will never tell you the full story (see Anscombe’s Quartet – the four data series all have the same statistical summaries, but looking at the visuals, each of them tells a different story).
In cyber security (or information security), we have started calling the exploratory process “Hunting“. This closes the loop to our SIEM use-cases. Hunting is used to discover and define new detection use-cases. I see security teams leverage hunting capabilities to do exactly that. Extending their threat intelligence capabilities to find the more sophisticated attackers that other tools wouldn’t be able to identify. Or maybe only partly, but then in concert with other data sources, they are able to create a better, more insightful picture.
In the context of hunting, a client lately asked the following questions: How do you measure the efficiency of your hunting team? How do you justify a hunting team opposite an ROI? And how do you assess the efficiency of analyst A versus analyst B? I gave them the following three answers:
- When running any red-teaming approach, how quickly is your hunting team able to find the attacks? Are they quicker than your SOC team?
- Are your hunters better than your IDS? Or are they finding issues that your IDS already flagged? (substitute IDS with any of your other detection mechanisms)
- How many incidents are reported to you from outside the security group? Does your hunting team bring those numbers down? If your hunting team wasn’t in place, would that number be even higher?
- For each incident that is reported external to your security team, assess whether the hunt team should have found them. If not, figure out how to enable them to do that in the future.
Unfortunately, there are no great hunting tools out there. Especially when it comes to leveraging visualization to do so. You will find people using some of the BI tools to visualize traffic, build Hadoop-based backends to support the data needs, etc. But in the end; these approaches don’t scale and won’t give you satisfying visualization and in turn insights. But that’s what pixlcloud‘s mission is. Get in touch!
Put your hunting experience, stories, challenges, and insights into the comments! I wanna hear from you!