



Hunting in your security data is the process of using exploratory methods to discover insights and hopefully finding attacks that have previously been concealed. Visualization greatly simplifies and makes the exploratory process more efficient.
In my previous post, I talked about SIEM use-cases. I outlined how I go about defining detection use-cases. It’s not a linear process and it’s not something that is the same for every company. That’s also a reason why I didn’t give you a list of use-cases to implement in your SIEM. There are guidelines, but in the end, you need to build a use-case repository unique to your organization. In this post we are going to explore a bit more what that means and how a ‘hunting‘ capability can help you with that.
There are three main approaches to implementing a use-case in a SIEM:
- Rules: Some kind of deterministic set of conditions. For example: Find three consecutive failed logins between the same machines and using the same username.
- Simple statistics: Leveraging simple statistical properties, such as standard deviations, means, medians, or correlation measures to characterize attacks or otherwise interesting behavior. A simple example would be to look at the volume of traffic between machines and finding instances where the volume deviates from the norm by more than two standard deviations.
- Behavioral models: Often behavioral models are just slightly more complicated statistics. Scoring is often the bases of the models. The models often rely on classifications or regressions. On top of that you then define anomaly detectors that flag outliers. An example would be to look at the behavior of each user in your system. If their behavior changes, the model should flag that. Easier said than done.
I am not going into discussing how effective these above approaches are and what the issues are with them. Let’s just assume they are effective and easy to implement. [I can’t resist: On anomaly detection: Just answer me this: “What’s normal?” Oh, and don’t get lost in complicated data science. Experience shows that simple statistics mostly yield the best output.]
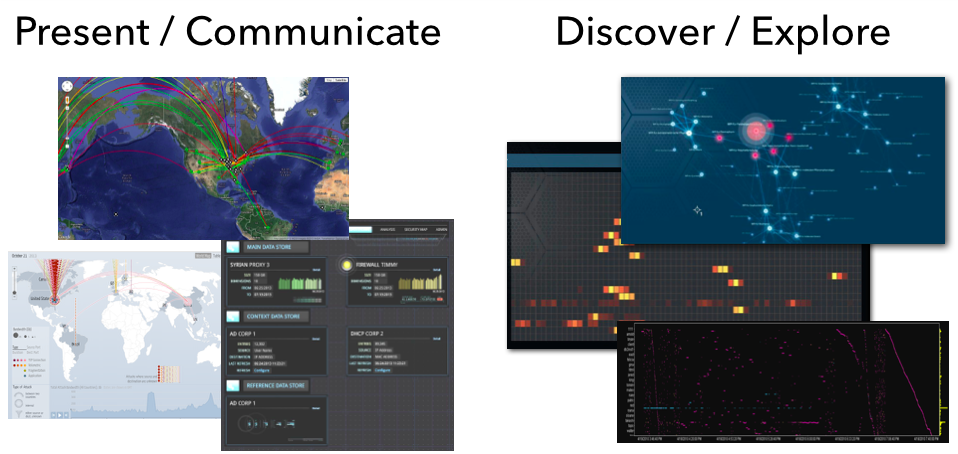
Let’s bring things back to visualization and see how that related to all of this. I like to split visualization into two areas:
- Communication: This is where you leverage visualization to communicate some property of your data. You already know what you want the viewer to focus on. This is often closely tied to metrics that help abstract the underlying data into something that can be put into a dashboard. Dashboards are meant to help the viewer gain an overview of what is happening; the overall state. Only in some very limited cases will you be able to use dashboards to actually discover some novel insight into your data. That’s not their main purpose.
- Exploration: What is my data about? This is literal exploration where one leverages visualization to dig into the data to quickly understand it. Generally we don’t know what we are going to find. We don’t know our data and want to understand it as quickly as possible. We want insights.
From a visualization standpoint the two are very different as well. Visually exploring data is done using more sophisticated visualizations, such as parallel coordinates, heatmaps, link graphs, etc. Sometimes a bar or a line chart might come in handy, but those are generally not “data-dense” enough. Following are a couple more points about exploratory visualizations:
- It important to understand that these approaches need very powerful backends or data stores to drive the visualizations. This is not Excel!
- Visualization is not enough. You also need a powerful way of translating your data into visualizations. Often this is simple aggregation, but in some cases, more sophisticated data mining comes in handy. Think clustering.
- The exploratory process is all about finding unknowns. If you already knew what you are looking for, visualization might help you identify those instances quicker and easier, but generally you would leverage visualization to find the unknown unknowns. Once you identified them, you can then go ahead and implement those with one of the traditional approaches: rules, statistics, or behaviors in order to automate finding them in the future.
- Some of the insights you will discover can’t be described in any of the above ways. The parameters are not clear or change ever so slightly. However, visually those outliers are quite apparent. In these cases, you should extend your analysis process to regularly have someone visualize the data to look for these instances.
- You can absolutely try to explore your data without visualization. In some instances that might work out well. But careful; statistical summaries of your data will never tell you the full story (see Anscombe’s Quartet – the four data series all have the same statistical summaries, but looking at the visuals, each of them tells a different story).
In cyber security (or information security), we have started calling the exploratory process “Hunting“. This closes the loop to our SIEM use-cases. Hunting is used to discover and define new detection use-cases. I see security teams leverage hunting capabilities to do exactly that. Extending their threat intelligence capabilities to find the more sophisticated attackers that other tools wouldn’t be able to identify. Or maybe only partly, but then in concert with other data sources, they are able to create a better, more insightful picture.
In the context of hunting, a client lately asked the following questions: How do you measure the efficiency of your hunting team? How do you justify a hunting team opposite an ROI? And how do you assess the efficiency of analyst A versus analyst B? I gave them the following three answers:
- When running any red-teaming approach, how quickly is your hunting team able to find the attacks? Are they quicker than your SOC team?
- Are your hunters better than your IDS? Or are they finding issues that your IDS already flagged? (substitute IDS with any of your other detection mechanisms)
- How many incidents are reported to you from outside the security group? Does your hunting team bring those numbers down? If your hunting team wasn’t in place, would that number be even higher?
- For each incident that is reported external to your security team, assess whether the hunt team should have found them. If not, figure out how to enable them to do that in the future.
Unfortunately, there are no great hunting tools out there. Especially when it comes to leveraging visualization to do so. You will find people using some of the BI tools to visualize traffic, build Hadoop-based backends to support the data needs, etc. But in the end; these approaches don’t scale and won’t give you satisfying visualization and in turn insights. But that’s what pixlcloud‘s mission is. Get in touch!
Put your hunting experience, stories, challenges, and insights into the comments! I wanna hear from you!
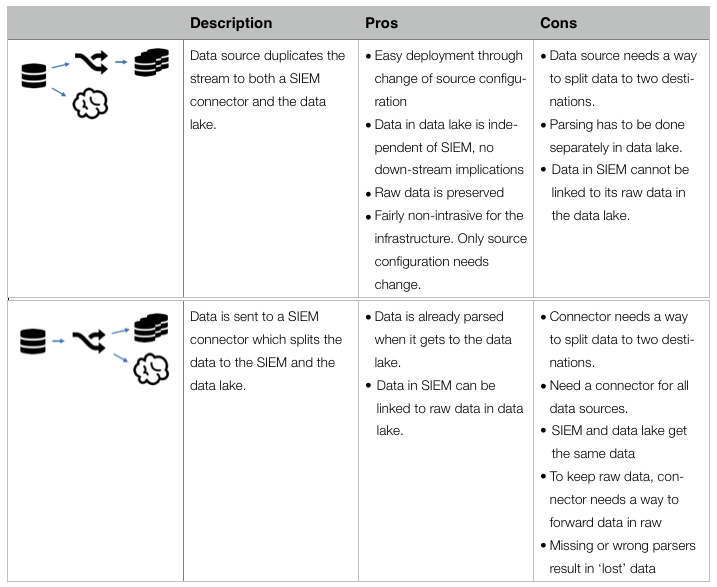
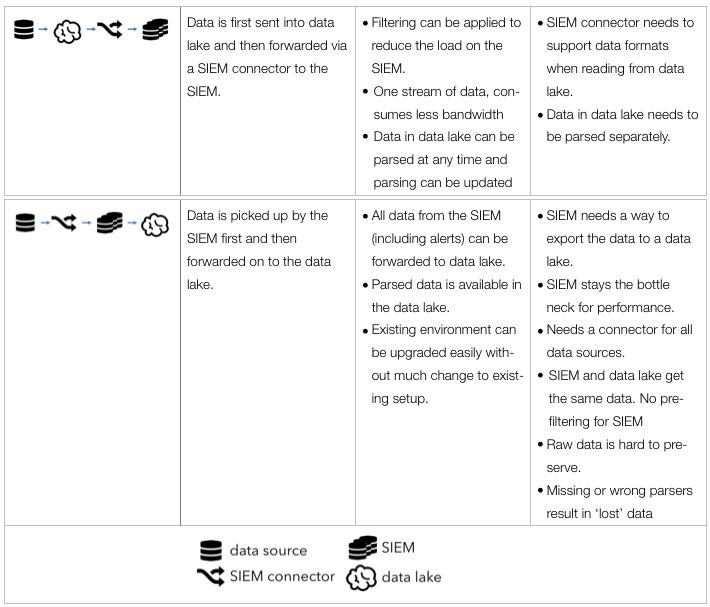

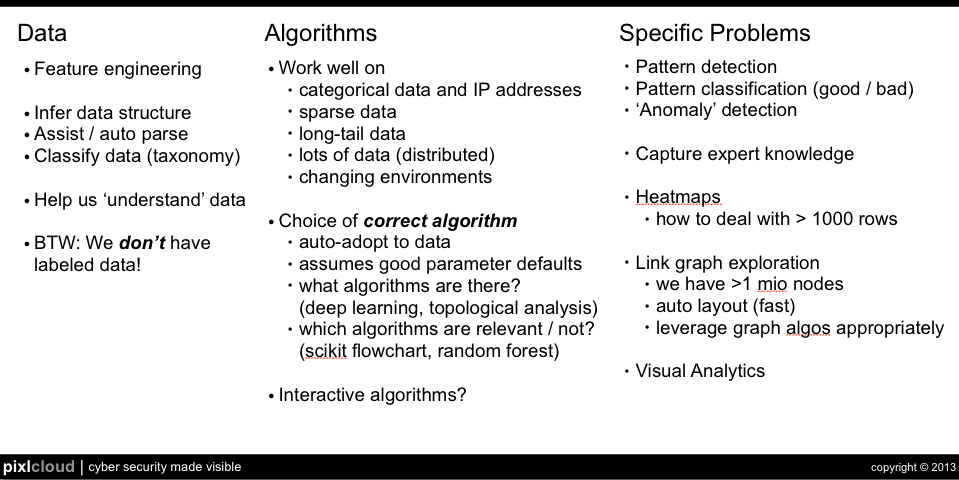
 Big data doesn’t help us to create security intelligence! Big data is like your relational database. It’s a technology that helps us manage data. We still need the analytical intelligence on top of the storage and processing tier to make sense of everything.