Finally! I worked on this AfterGlow release forever. I submitted a few checkpoints to CVS before I felt read to released AfterGlow 1.5.8. I highly recommend upgrading to 1.5.8. It has a few bugfixes, but what you will find most rewarding is the new color assignment heuristic and the capability to change the node sizes. Here is the complete changelog:
06/10/07        Version 1.5.8

- Nodes can have a size now:

(size.[source|target|event]=<expression returning size>)

Size is accumulative! So if a node shows up multiple times, the

values are summed up!! This is unlike any other property in

AfterGlow where values are replaced.

- The maximum node size can be defined as well, either with a property:

(maxnodesize=<value>)

or via the command line:

-m=<value>

The size is scaled to a max of 'maxsize'. Note that if you

are only setting the maxsize and no special sizes for nodes

Afterglow will blow the nodes up to optimal size so the labels

will fit.

There is a limit also, if you want the source nodes to be a max of say

1, you cannot have the target nodes be scaled to fit the labels. They

will have a max size of 1 and if you don't use any expression, they will

be of size 1. This can be a bit annoying ;)

Be cautious with sizes. The number you provide in the assignment is not the actual size

that the node will get, but this number will get scaled!

- One of the problems with assignments is that they might get overwritten with later nodes

For example, you have these entries:

A,B

A,C

and your properties are:

color="blue" if ($fileds[1] eq "B")

color="red"

you would really expect the color for A to be blue as you specified that explicitly.

However, as the other entry comes later, the color will end up being red. AfterGlow takes

care of this. It will determine that the second color assignment is a catch-all, identified

by the fact that there is no "if" statement. If this happens, it will re-use the more specific

condition specified earlier. I hope I am making sense and the code really does what you would

expect ;)

- Define whether AfterGlow should sum node sizes or not.

(sum.[source|target|event]=[0|1];)

by default summarization is enabled.

- Added capability to define thresholds per node type in properties file

(threshold.[source|event|target]=<value>;)

- Added capability to change the node shape:

shape.[source|event|target]=

(box|polygon|circle|ellipse|invtriangle|octagon|pentagon|diamond|point|triangle|plaintext)

- Fixed an issue where, if you use -t to only process two columns

and you can use the third in the property file for size or color.

The third column was not carried through, however. This is fixed!

- The color assignment heuristic changed a bit. Along the same lines that the size assignment works.

Catch-alls are not taking presedence anymore. You might want to take this into account when defining

colors. The catch-all will only be used, if there was never a more specific color assignment that

was evaluated for this node. For example:

color="gray50" if ($fields[2] !~ /(CON|FIN|CLO)/)

color="white"

This is used with a three-column dataset, but only two are displayed (-t). If the first condition

ever evaluated to true for a node, the last one will not hit, although the data might have a node that

evaluates to false in the first assignment and then the latter one would grip. As a catch-all it does

get superior treatment. This is really what you would intuitively assume.

- Just another note on color. Watch out, if you are definig colors not based on the fields in the

data, but some other conditions that might change per record, you will get the wrong results as

AfterGlow uses a cache for colorswhich keys off the concatenation of all the field values. Just

a note! Anyone having problems with this? I might have to change the heuristic for caching then. Let

me know.
This is a pretty random blog entry, but oh well… I am sitting in the London airport. In the lounge here, they have a computer that is connected to the Internet. I sat down, opened a browser, typed in my webmail domain and paused for a second. Then I opened a command shell and checked for open ports, processes running, and all that. Well, I still felt like I couldn’t enter my password. What if a keylogger was running?
Then I had an idea. I opened a notepad and just entered some random characters. Then I started, using the mouse, to rearrange the letters into my username and password. A key logger is not able to capture my password like this. I _think_ I successfully circumvented these beasts.
I know, there are other trojans, such as transaction generators that could get in my way, but …
Not too long ago, I posted an entry about
CEE, the Common Event Expression standard which is a work in progress, lead by Mitre. I was one of the founding members of the working group and I have been in discussions with Mitre and other entities for a long time about common event formats. Anyways, one of the comments to my blog entries pointed to an effort called
Distributed Audit Service (XDAS). I have not heard of this effort before and was a bit worried that we started something new (CEE) where there was already a legitimate solution. That’s definitely not what I want to do. Well, I finally had time to read through the 100! page document. It’s not at all what CEE is after. Let me tell you why XDAS is not what we (you) want:
How many people are actually using this standard for their audit logs? Anyone? I have been working in the log management space for quite a while and not just on the vendor side, but also in academia. I have NEVER heard of it before. So why should I use this if nobody else is? In contrast, CEF from ArcSight is in use not just by ArcSight itself, but many of its partners.
I just mentioned it before. 100 pages! What’s the last time you read through 100 pages? I just did. Took me about an hour to read the document and I skipped a lot of the API definitions. My point being: A standard should be at most 10 pages! It’s not just the length of the document, it’s the complexity which comes with it. Nobody is going to read and adhere to this. The more you demand, the more mistakes are being made by vendors which implement this. Oh, and please don’t tell me to only read pages 1-10! Make it 10 pages if you want me to read only those.
How much time does it take to actually implement this? Has anyone done it? How long did it take you? I bet a couple of weeks, plus QA, etc. Much too long. I am NEVER going to make that investment.
Let’s get into details. Gosh. Why does this define APIs? Don’t dictate how I should do things. A standard needs to define the common interface, not how I have to open a stream and safe files and so on. It’s overkill. The implementations will differ and they should! And why lock yourself into this API transport. Can you support other transports?
It seems that there is an XDAS service that I need to integrate with. What is that? That’s not clear to me. Can I exchange logs (audit records) between just to parties or do I need an intermediary XDAS service? I am confused.
Keep the scope of the standard to what it wants to accomplish: event interchange! This thing talks about access control, RBAC, filtering, etc. Why? Please! That’s absolutely unnecessary and should not be part of an interchange standard!
In general, I am quite confused about the exact setting of this. Are we only talking about audit records? Security related only? What about other events? I want this to be very generic! Don’t give me a security specific solution! The world is opening up! We need generic solutions!
What kind of people wrote this? Using percent signs to escape entries and colons to separate them? Must be from the old AS/400 world … Sorry… I just had to say this, in a world of CSV and key-value pairs it is sort of funny to see these things.
The glossary could really benefit from a definition of event and log.
The standard requires a measure of uncertainty for timestamps. I have never heard of this. Could you please elaborate? How can I measure time uncertainty???
In section 2.5, access IDs and principle IDs are mentioned. What’s that?
Although the standard does not position itself with log management, it talks about alarms and actions. Why would you need to mention actions in this context at all?
A pointer to the original log entry? How do you do that? Log rotation, archiving, leave alone the mere problem of how to reference the original entry to start with.
Why does the standard require the length of a record to be communicated? Just drop that.
The caller has to provide an event_number. I like it. But sorry folks, syslog does not have it. How do you get that in there?
Originator identity: It specifies that this should be the UNIX id. ID of what? The process that logs? The user that initiated the action? The remote user that sent the packet to this machine to trigger some action? How do you know that?
I like the list of XDAS events. It’s a good start, but it’s definitely not all we need. We need much more! Again a nice list to start with.
Why is there so much information encoded in the outcome, instead of defining individual entries? There might be a valid reason, but please motivate these decisions.
That’s what I have for a quick review. Again, no need for us to stop working on CEE. There is still a need for a decent interoperability standard.
[tags]interoperability, log, event exchange, common exchange format, common event expression, log management[/tags]
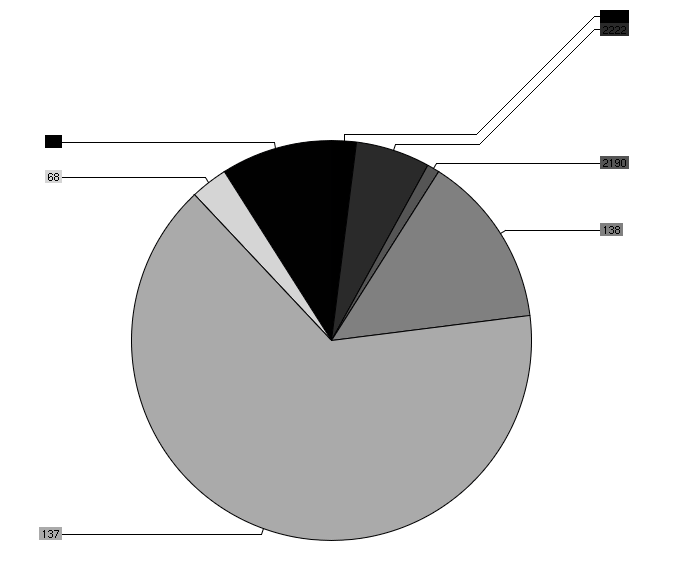
My R journey seems to be over… It’s just too complicated to get charts and plots right with R. I found a new library that I staerted playing with: chart director. I am using Perl to drive the graph generation and it’s actually fairly easy to use. There are some cumbersome pieces, such as seg-faults when you have NULL values in a matrix that you are drawing, but that’s things I can deal with ;
Here is a sample graph I generated: (I know, the color selection is fairly horrible!)
I just finished reading the Information Dashboard Design book by Stephen Few. I love it. I am definitely going to use some of the concepts that I learned about for my own book. I especially like how Stephen illustrates Tufte’s principle of reducing the non-data ink in charts. Definitely a book people who are building dashboards should read!
Log analysis has shifted fairly significantly in the last couple of years. It is not about reporting on log records (e.g., Web statistics or user logins) anymore. It is all about pinpointing who is responsible for certain actions/activities. The problem is that the log files do oftentimes not communicate that. There are instances of logs (mainly from network centric devices), which contain IP addresses that are used to identify the subject. In other instances, there is no subject that can be identified in the log files at all (database transactions for example).
What I really want to identify is a person. I want to know who is to blame for deleting a file. The log files have not evolved to a point where they would contain the user information. It generally does not help much to know what machine the user came from when he deleted the file.
This all is old news and you probably are living with these limitations. But here is what I was wondering about: Why has nobody built a tool or started an open source project which looks at network traffic to extract user to machine mappings? It’s not _that_ hard. For example SMB traffic contains plain-text usernames, shares, originating machines, etc. You should be able to compile session tables from this. I need this information. Anyone? There is so much information you could extract from network traffic (even from Kerberos!). Most of the protocols would give you a fair understanding of who is using what machine at what time and how.
[tags]identify correlation, user, log analysis, user mapping[/tags]
I am teaching a workshop at FIRST in Seville in June about Visualizing Insider Threat Data. I recorded a PodCast introducing my workshop and talking about visualization in general.
I was just listening to this podcast about security information management (SIM) systems. Tom Bowers from Information Security magazine is talking about various topics in SIM. Unfortunately I have to disagree with Tom on a couple of points, if not more. But let me pick the couple I find most important:
Visualization is a great tool to see attacks in real-time. However, you can only see where the attacks are coming from and not how many. What? Why would I not be able to visualize that? You can map that to edge size, node size, map it as a color to you nodes, etc. I don’t know what system he looked at to make this statement, but that’s wrong!
Active Response is something that SIMs cannot do. Well. Wrong again. I could tell you how ArcSight is doing this with the Threat Response Manager (TRM), but that would be a vendor pitch. That’s why I am going to mention SEC, the simple correlation engine. It can execute an arbitrary action. Well, it’s not quantum leaps from there to imagine how you could issue a command to add an ACL to a router for example. To sum up: Active response is something SIMs can do! If you want to know how exactly you do this with SEC, read my chapter on event analysis in the new Snort book.
These were the main points where I disagree with Tom. He could have done a bit of a better job describing the benefits of visualization, but that’s another story.
I was trying to get my Ubuntu desktop to use Beryl, just like my laptop does. Unforunately, my NVidia drivers didn’t quite want to do what I wanted them to do. Long story short, at some point I remembered to check in the log files to see whether I could determine what exactly the problem was. Where should I look first? /var/log/messages And right there it was:
May 11 11:15:12 zurich kernel: [ 2503.193111] NVRM: API mismatch: the client has the version 1.0-9631, but

May 11 11:15:12 zurich kernel: [ 2503.193114] NVRM: this kernel module has the version 1.0-9755.  Please

May 11 11:15:12 zurich kernel: [ 2503.193115] NVRM: make sure that this kernel module and all NVIDIA driver

May 11 11:15:12 zurich kernel: [ 2503.193117] NVRM: components have the same version.
Beautiful. That’s exactly what I needed to know. But hang on a second. Isn’t this a syslog entry? Wow. It just hit me. While I really liked the verbose output, I was trying to think about how I would parse this thing. How would I normalize this message to later apply machine logic to further process this? Aweful!
I guess my conclusion would be that we need two types of Syslogs! One that logs machine readable log entries and one for humans. Is that really what we want? Maybe the even better solution would be to only have a machine readable log and then provide an application that can read the log and blow the contents up to make it readable for humans!
Although I work in the log/event management space and therefore help organizations to gather more information about people, I am a big opponent of personal information collection.
I flew back from Switzerland to San Francisco after my Christmas break and was in for a surprise. Not only did they want my passport (which I can sort of understand ;), but they also wanted me to fill out an additional form with my address in San Francisco, a contact person, etc. Why do they need all that? And then there is still the controversy about the airlines giving passenger information to the TSA and possibly other US agencies. I just don’t know what they use all this information for? To flag potentially dangerous passengers? What was the rate of false positives for that? I wish everyone had stringent laws as the EU for personal data. At least I would have a chance to find out what the data is that they have about me and possibly correct it!
Are you a non-US citizen, and if so, did you enter the US lately? Yes? Picture taken, finger prints (soon to be 10, not just 2). Even more data they collect. I’ve got to tell you, it’s not just the wait in the immigration hall that annoys me. It’s all the data they collect. And that’s what tirggered my post. I wouldn’t have that much of a problem, if they actually told me what they were going to do with the data and kept it safe.
Maybe they are starting to rethink the “data collection” after more and more of the US agencies are suffering data leaks. Now the TSA itself. Hopefully they realize that they should either start to be serious about data security or stop collecting information!