August 13, 2008
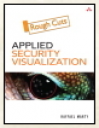 The Applied Security Visualization book is DONE and available in your favorite store!
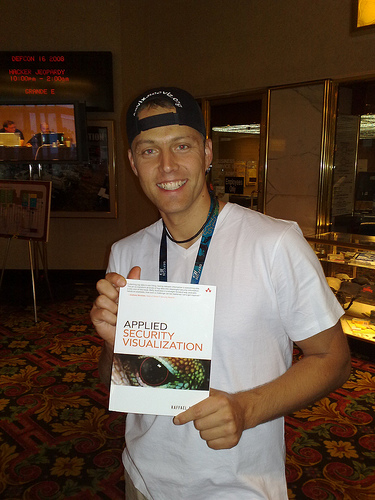
Last Tuesday when I arrived at BlackHat, I walked straight up to the book store. And there it was! I held it in my hands for the first time. I have to say, it was a really emotional moment. Seeing the product of 1.5 years of work was just amazing. I am really happy with how the book turned out. The color insert in the middle is a real eye-catcher for people flipping through the book and it greatly helps making some of the graphs better interpretable.
 I had a few copies to give away during BlackHat and DefCon. I am glad I was able to give copies to some people that have contributed by inspiring me, challenging me, or even giving me very specific use-cases that I collected in the book. Thanks everyone again! I really appreciate all your help.
People keep asking me what the next project is now that the book is out. Well, I am still busy. secviz.org is one of my projects. I am trying to get more people involved in the discussions and get more people to contribute graphs. Another project I am starting is to build out a training around the book, which I want to teach at security conferences. I have a few leads already for that. Drop me a note if you would be interested in taking such a training. Maybe I will also get some time to work on AfterGlow some more. I have a lot of ideas on that end…
During DefCon, I recorded a PodCast with Martin McKeay where I talk a little bit about the book.
June 17, 2008
 I am presenting at the FIRST 2008 conference in Vancouver next week. I am speaking on my birthday, June 25th, from 9.50 until 12.50. The topic is “Applied Security Visualization” – the same as my book title. I am going through some of the material from the book and show how visualization can be used to analyze log files.
Some of the highlights:
- I am going to show how you can use Splunk to manage not just single-line logs, but also analyze multi-line data, such as data from top, ps, etc.
- I am showing how you can use AfterGlow with Splunk.
- I am probably going to show a sneak peak of DAVIX. The Data Visualization and Analysis Linux (DAVIX) is a live CD that will be released at BlackHat this year.
May 30, 2008
The Applied Security Visualization book is slowly coming together. I finished implementing all the reviews from my reviewers yesterday. This means I am almost done. The only thing left is the introduction.
By the way, my reviewers were absolutely amazing. I couldn’t have wished for a better team. Thanks guys!
The rought-cuts version of “Applied Security Visualization” is now also available. It’s an electronic version of, I think, 4 of the chapters. You can also pre-order the book on Amazon. This is all really exciting. Finally, after 1.5 years, the book is close to be done. Let’s hope for a launch in August, at BlackHat!
April 7, 2008
This week, the RSA Security conference is taking place in San Francisco. Just a few things I want to capture:
- I will be speaking on Thursday morning 8am! Topic of the presentation: “A Journey Through Security Visualization“. I am co-presenting with Alain Mayer from RedSeal.
- I am announcing the rough-cuts version of my Applied Security Visualization book. This is an online version of three chapters of the book. You can get an electronic version and give me feedback on them. Not that I didn’t have enough to do with the comments from my reviewers already 😉
- I am going to be hanging out at various events and parties during the week. My schedule during the day is really full at this point, but I would love to meet you during the evening activities. Hit me up or check my Twitter feed for where I am at: @zrlram.
- I am most likely going to be at the Blogger Meetup on Wednesday. [If Splunk is not going to drag me into the Analyst dinner.]
So, given all this, it’s going to be both a busy and a fun week. Hope to see ya all there!
[tags]visualization, rsa security, visualization[/tags]
March 7, 2008
 I will be at Source Boston next week, which is going to be probably one of the coolest conferences this year. The speaker lineup is absolutely fantastic. And I am not saying that because I am going to be speaking there. You can keep up with the conference on the Source Boston Blog or on the Twitter @SourceBoston feed.
My presentation carries the title: All the data that’s fit to visualize. Recognize this? It’s the New York Time’s headline. I am going to talk about what security visualization can learn from the NYT. I am very excited about the talk. I am going to try out some new presentation methods. Come and see it!
[ tags]security visualization, source boston, applied security visualization[/tags]
January 31, 2008
 This week I finally attended Edward Tufte’s one-day visualization course. It was a great day, filled with inspiration. I had seen Tufte’s books before and read a lot about his theories and principles. I have been very inspired by a lot of them and I am trying to make use of them in my own book on “Applied Security Visualization“. Tufte has a certain way of pondering a topic that makes you think hard – even about the most controversial things; such as: “Forget PowerPoint”. He has some good arguments and maybe I will try some of his principles in my next presentation.
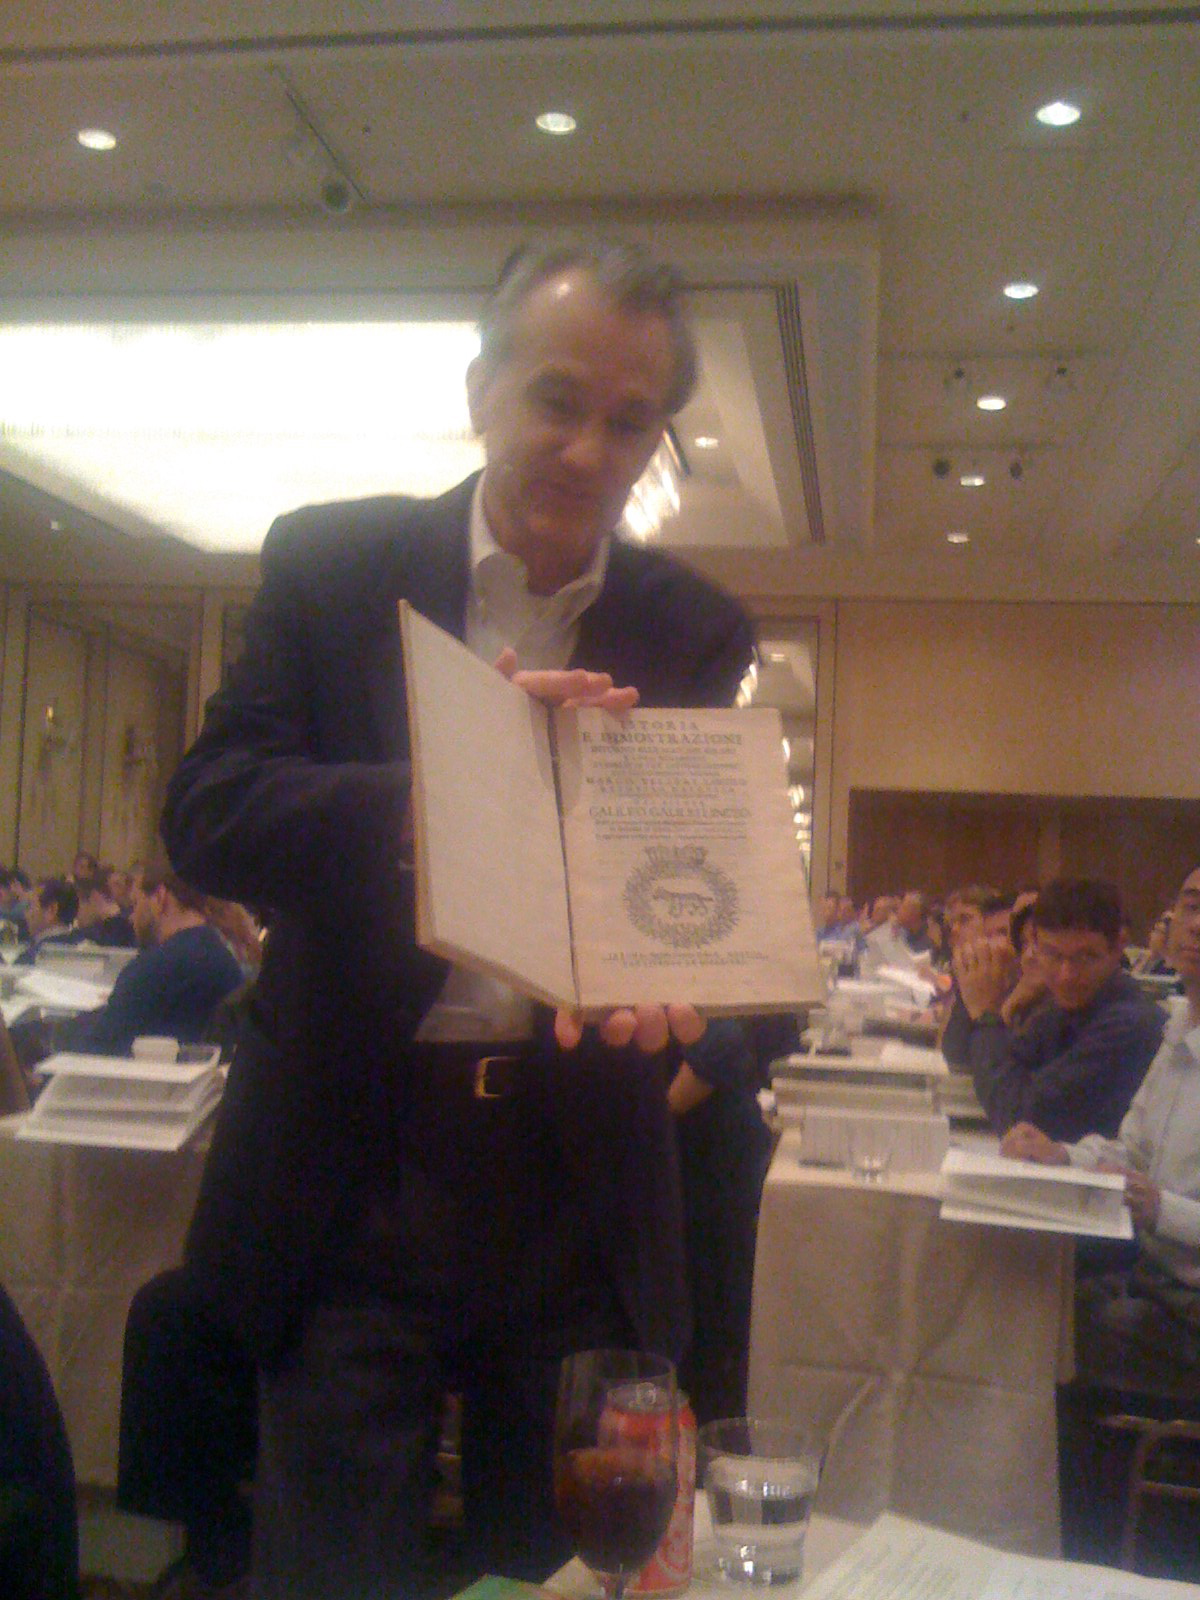
I was definitely impressed with the two books he brought along to the course. He showed one of the first prints of Galileo’s book. An absolutely beautiful piece of work! Notice how E.T. holds the book in his bare hands (picture below), while his assistant is wearing gloves.
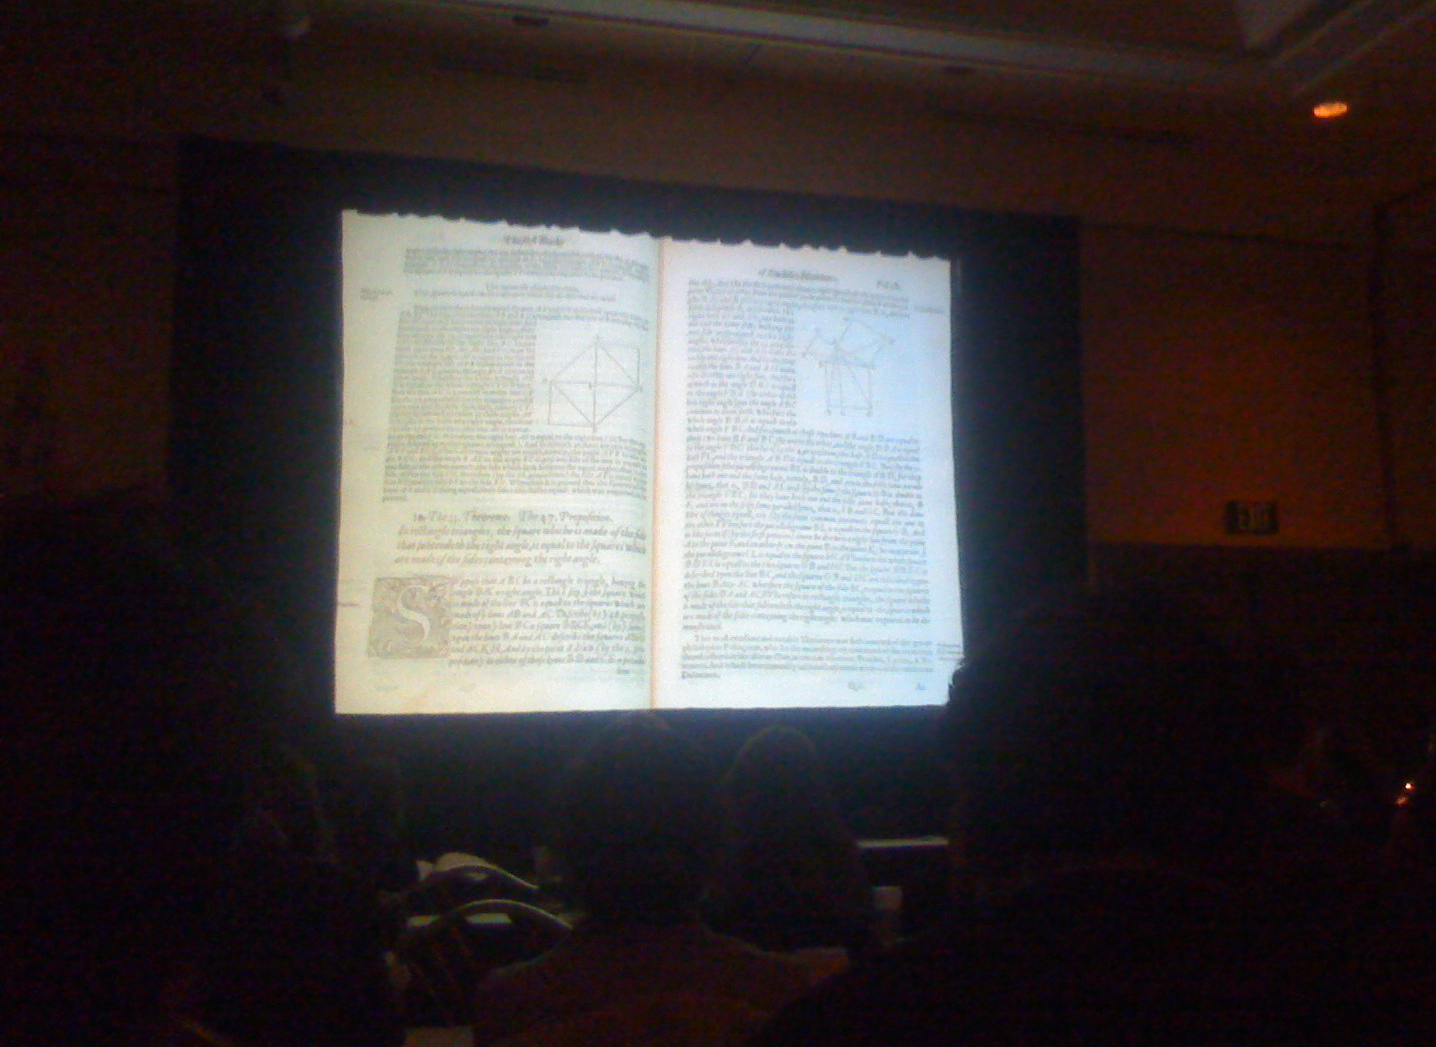
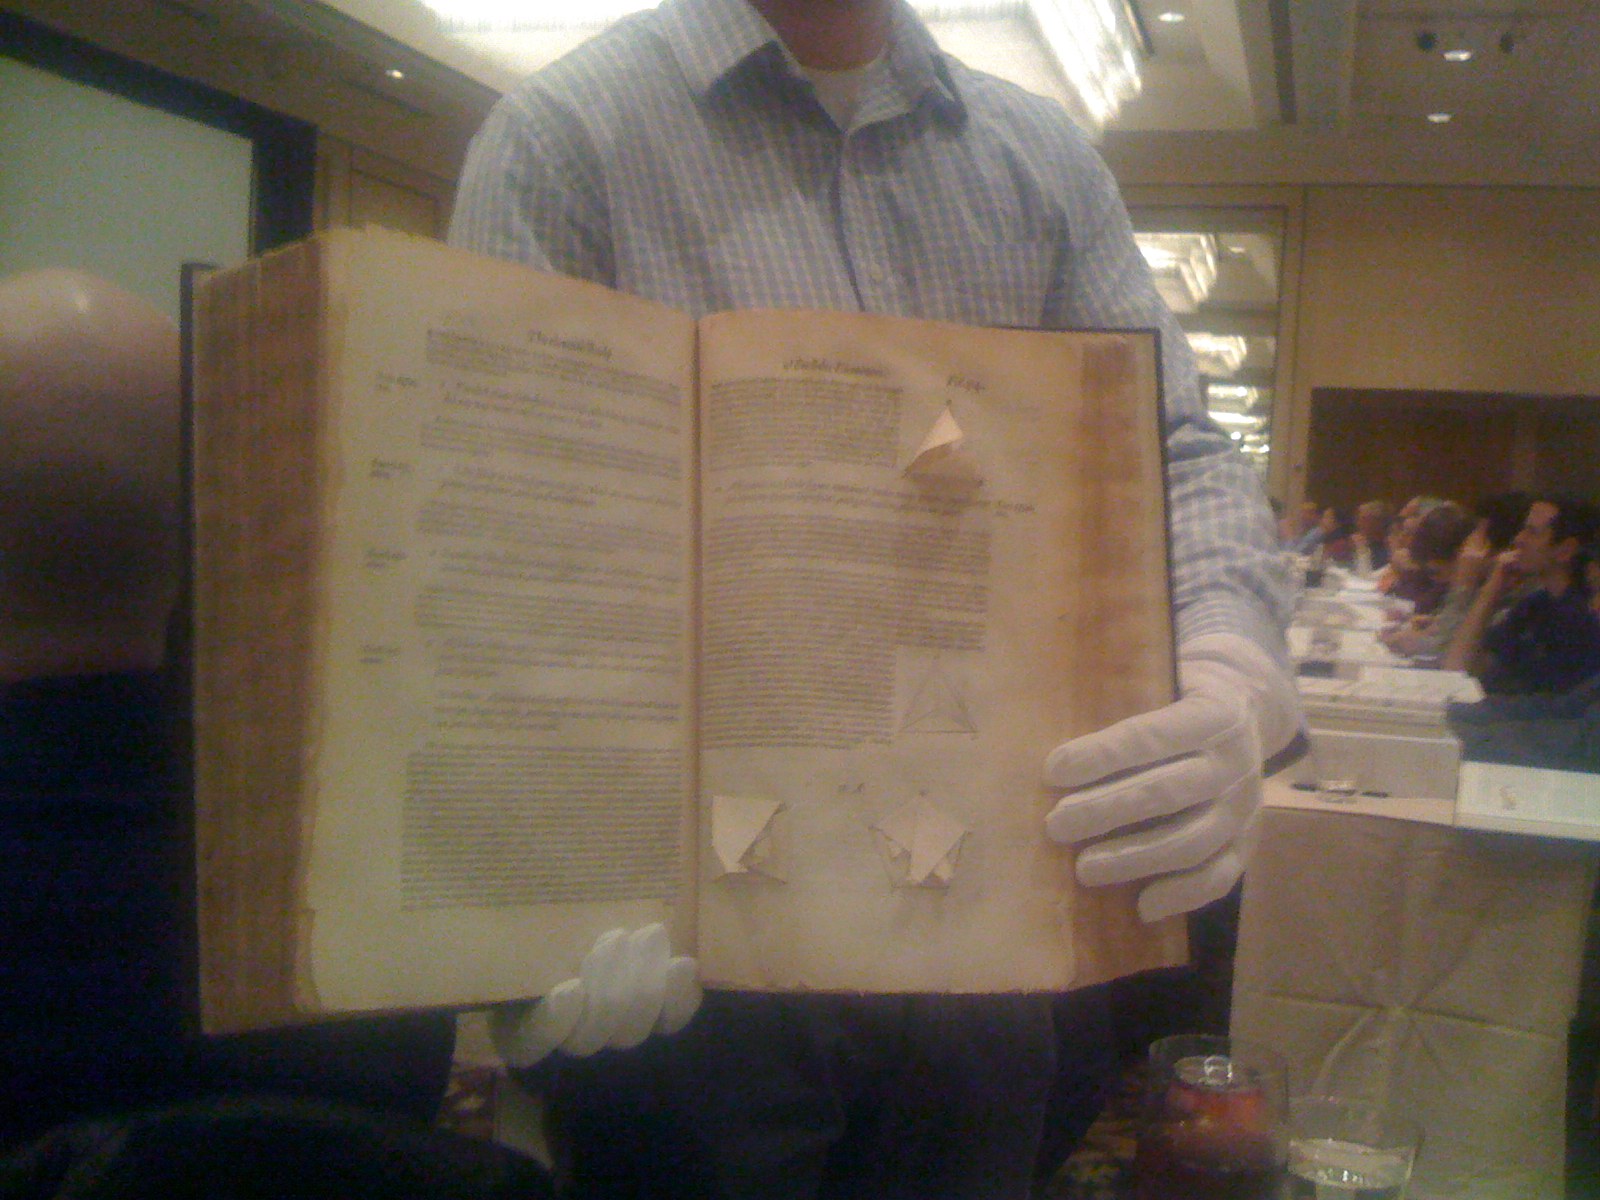
The other book he brought along was one of the first prints of Euclid’s book where all the Euclidean geometry is explained. Note the three-dimensional pyramids in the book. Amazing for a book that was printed hundreds of years ago!


January 24, 2008

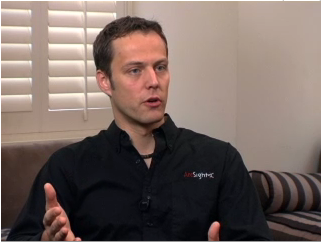
OnSecrity just released another video of the conversation we recorded last year during RSA. I am talking about security visualization in light of the book I am working on. This video cast is the sequel to the first one that I posted a few days ago.
 One of the topics I am discussing in the video is the “false dichotomy” between security and visualization. This is a topic that I talked about during a talk at the MIT Lincoln Labs at the beginning of December. The presentation showed how there are really two disciplines that come together in security visualization: Security and Visualization. The problem with this is that visualization people don’t know much about security and the other way around. It’s a very interesting topic to explore and it explains some of the mistakes that are being made with visualization tools and is also reflected in visualization research.
[tags]visualization, security, videocast[/tags]
January 18, 2008
 It is pretty much exactly a year ago that I signed my contract with Addison Wesley to write a book about security data visualization. Now, a year later, I am getting really close. I am in the process of assembling my review committee and I a very excited about a couple of people that already accepted. Thanks in advance!
There is still a lot to be done. I have one more big chapter to write: “Perimeter Threat” and a couple to finish up. But I can see the end! It’s nice to see the end being close!
A little more than a month after I signed my contract with my publisher, they recorded a video cast with me. I am talking about security visualization and a little bit about the book. Beware, this was a year ago. It is interesting, however, that I would probably still say about the same things! This shows that the market has not really changed much. I hope this will change soon though!
October 15, 2007
 I was playing with database audit logs for a bit to try and visualize some aspects of them. While doing so, I came across a pretty interesting problem. The audit logs contain entries that indicate what exact SQL query was executed. Now, I am not interested in the entire query, but I need to know which tables were touched. I was trying to build some regular expressions to extract that information from the query, but I gave up pretty quickly. It’s just too complicated for a regex. I was wondering whether there is a way to take a SQL query, for example:
select * from a.table1 a, b.tabl2 b join c.table3 on b.id1=c.id2 where a.foo='bar'
and extract all the table names: a.table1, b.table2, c.table3. Are there tools to do that? Remember, I don’t have the database with these tables. I only have a log from some database. The script should support all the SQL perks like joins, nested selects, etc. Anyone have a good way to do this?
October 11, 2007
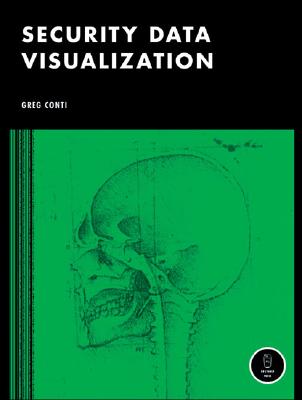 Greg Conti wrote a book on security data visualization. It’s all in color. A really nice book. The best parts about the book are the chapters on IDS signature tuning and firewall log analysis. I am just saying that because I wrote those two chapters 😉
He beat me to the punch with publishing a book on security data visualization. That’s all I can say. I hope that I am done with my book soon. Fortunately, I knew about this book early on so I could make sure that we are not writing about the same topics. My book is going to be fairly different. I am diving quite a bit deeper into some visualization topics around security. I am focusing on use-cases. How do you use visualization for compliance, insider threat, and perimeter threat. What are some of the tools out there, what are the data sources, and what are the different types of graphs you should know and understand when you are visualizing security data.
Thanks to Greg for letting me write part of his book!

 I had a few copies to give away during BlackHat and DefCon. I am glad I was able to give copies to some people that have contributed by inspiring me, challenging me, or even giving me very specific use-cases that I collected in the book. Thanks everyone again! I really appreciate all your help.