May 25, 2010
I thought you might be interested in some blog posts that I have written lately. I have been doing quite a bit of work on Django and Web applications. That might explain the topics of my recent blog posts. Check them out.
Would love to hear from you if you have any comments. Either leave a comment on the blogs, or contact me via Twitter at @zrlram.
May 4, 2009
 For the month of May, I am doing a guest blog on CISCO Subnet. I will be discussing various topics around data visualization. You should stop by and check it out. If you have any topics that you are interseted in, let me know as well.
April 20, 2009
 PixlCloud is my latest employer. I founded the company two weeks ago. It is going to be a company that offers a service in the cloud. The mission of the company is to build a data visualization SaaS. Users can submit their data to the service and then interactively visualize it. One of the cornerstones of the service is that anyone should be able to use it. You won’t have to be a visualization expert or an expert in data mining or alike.
I am gathering user input. If you feel like you have a need for such a data visualization service or you would like to offer your input for any aspect of my company, be that the market, the product, the users, marketing, product features, or really anything, drop me a line.
January 15, 2009
Have you seen the book Applied Security Visualization on the shelf at your local book store? If so, send me a picture and I will post it…
My friend Jan spotted the book on November 28th at the Eason Bookshop on O’Connell St in Dublin:

January 5, 2009
 Richard Bejtlich rated Applied Security Visualization as the second best security book in 2008! Read more about the books Richard read at: Best Book Bejtlich Read in 2008. Thanks Richard!
[tags]applied security visualization, security, visualization, security books, books[/tags]
December 7, 2008
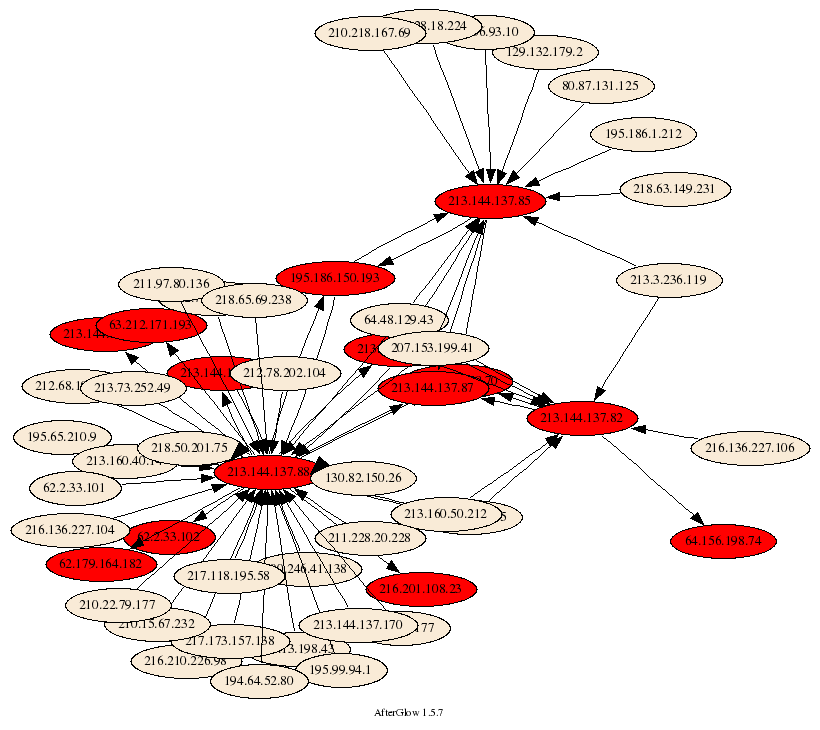
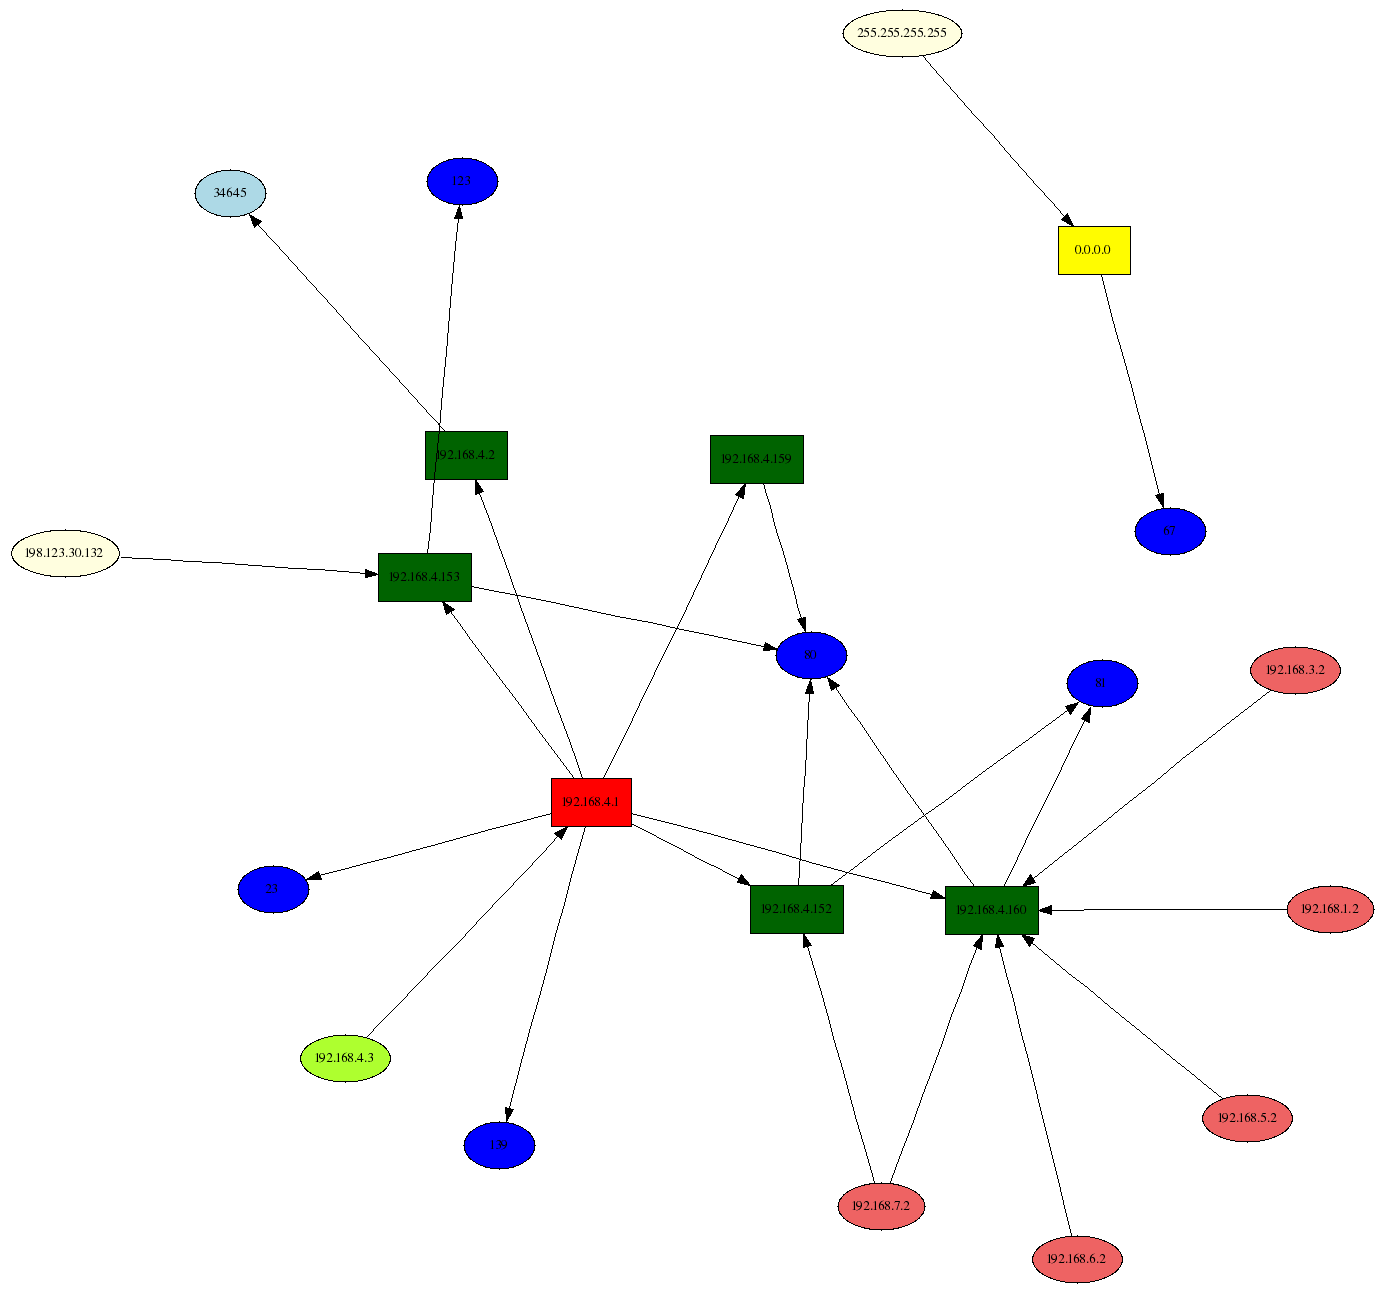
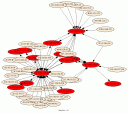 I have been using link graphs a lot in my work of visualizing security data. They are a great methods to display relationships between entities. I guess the most used link graph is one that shows communications of machines. The nodes represent the communicating machines and arrows connecting them show flows.
You can use color and shape to encode more information, such as the amount o traffic transmitted or a machine’s role. I even extended the graphs to show three types of nodes: source nodes, event nodes, and target nodes.
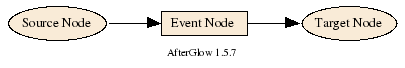
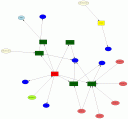
This lets me encode more information in a graph, such as the machines communicating and the service they used, as shown on the right.
All of this has been incredibly useful. However, for the longest time I have been thinking about how to include time into link graphs. To date, I don’t really have a good solution. Here are some things I have considered:
- Animation: This is the most obvious solution. You use a tool that replays the data. Use fast forward to speed up the animation. Ideally the tool would allow for forwarding and reversing the animation, just like the controls you have to watch a movie. This approach has the disadvantage of change blindness. There are changes that the human brain will not notice. And the probably even bigger problem are the layout algorithms that are generally not built for incremental updates. Adding new nodes to a graph moves the existing ones around and the viewer cannot locate them anymore. [I wrote about this in my book in Chapter 3.] You can counter the problem of instability by assigning each node a pre-computed location. Use some hashing algorithm to do so.
- Color: The idea would be to assign color to nodes or edges. Use some sort of encoding to show time. For example, the lighter a color, the late it happened. This approach is very limited. There are only so many colors you have available. The human eye can only differentiate, really differentiate about 8 hues. Any more and it gets really hard to tell which node is brighter. [It might be more than 8, but the number is really really low]
- Using arrows that order the connections: This was an idea I had a while back. I don’t think it’s actually useful, but here it is anyways: You generate a link graph and then you introduce a set of arrows that connect the edges. The arrows indicate time, so you connect the earliest event with the second earliest , and so on. This will really clutter the display an is probably really hard to read.
- Paralll coordinates: Add a coordinate for time. This can help in some instances. In others the time-axis will just be completely cluttered. But worth a try.
- Multiple, linked views: The idea here is to generate your link graph and then in addition, you also generate a display that encodes time. For example, a time table. On the x-axis you show time and on the y-axis you show, the source node’s field. The problem here is how do you link the two displays. Interactivity is almost a must. So that you could click on a node and see it in the time chart. Even better would be if you could encode the relationships in the time table. However, that might be hard.
- Using a time-base layout algorithm: I am too bad of a coder to actually implement this idea. I am also not sure what the result would be like. The idea would be to define the attraction between nodes as the time distance. There are many problems. What do you do if a connection shows up at multiple instances in time? I haven’t thought this true. But maybe there is a possibility here.
Unfortunately, all of these solutions have drawbacks. I think I favor timecharts for showing time-based activity. But then, the number of entities you can track is limited, etc.
Anyone have a solution for showing time-based activity? Even if it’s animation, what are some of the key things that would help making the animation easy to follow?
[tags]visualization, link graph, network graph, time visualization[/tags]
October 29, 2008
 VizSec is a fairly academic conference that brings together the fields of security and visualization. The conference had an interesting mix of attendees: 50% came from industry, 30% from academia, and 20% from government. I had the pleasure of being invited to give a talk about DAVIX and also participate on a panel about the state of security visualization in the market place.
The highlight of the conference was definitely Ben Shneiderman’s keynote. I was very pleased with some of the comments that Ben made about the visualization community. First he criticized the same thing that I call the “industry – academia dichotomy”. In his words:
“[There is a] lack of applicability of research.”
I completely agree and if you have seen me talk about the dichotomy, I outline a number of examples where this becomes very obvious.
The second quote from Ben that I would like to capture is the following:
“The purpose of viz is insight, not pictures”
Visualization is about how to present data. I am not always sure that people understand that.
Unfortunately, I wasn’t prepared to capture what Ben said about my book (Applied Security Visualization.) He brought his copy that I had sent him. He talked about the book for quite a bit and specifically mentioned all the treemaps that I have used to visualize a number of use cases. I felt very honored that Ben actually looked at the book and had such great things to say about it. The following lunch with Ben was a great pleasure as well, filled with some really interesting visualization discussions.
September 6, 2008
 Next Tuesday I will be speaking in Graz, Austria at the FIT-IT event. The topic of the event is Trust in IT Systems & Visual Computing. I am giving a keynote in the afternoon about the topic of Security Research 2.0. I will be hitting on one of my favorite topics, the dichotomy between security and visualization. We need to all work hard on combining the worlds of visualization and the security. We have all seen what happens if security people are writing visualization tools. And we have seen what happens when visualization people try to understand networking and security. I can show you some pretty bad papers that get either side completely wrong. Maybe I am just too picky, but if you read some of the papers that I reviewed for RAID and VizSec, you would probably agree with me.
While talking about RAID and VizSec, the conferences are taking place in a week at MIT in Boston. I will be giving a short presentation on DAVIX with Jan Monsch and will also be part of a panel discussion. Looking forward to make my points about visualization there. I am going to stay for RAID and hope to catch up with my former collegues from IBM research. Drop me a note if you are attending as well.
August 20, 2008
I recorded a couple of podcasts and did some interviews lately about the book. If you are interested in listening in on some of the press coverage:
More information about the Applied Security Visualization book is on the official book page. I am working on figuring out where to put an Errata. There were some minor issues and typos that people reported. If you find anything wrong or you have any generic comments, please let me know!
August 14, 2008
I just saw the first Amazon review for my book. I just don’t understand why the person only gave it four stars, instead of five 😉 Just kidding. Thanks for the review! Keep them coming!