March 16, 2012
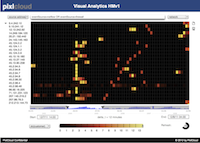 Big data doesn’t help us to create security intelligence! Big data is like your relational database. It’s a technology that helps us manage data. We still need the analytical intelligence on top of the storage and processing tier to make sense of everything. Visual analytics anyone?
A couple of weeks ago I hung out around the RSA conference and walked the show floor. Hundreds of companies exhibited their products. The big topics this year? Big data and security intelligence. Seems like this was MY conference. Well, not so fast. Marketing does unfortunately not equal actual solutions. Here is an example out of the press. Unfortunately, these kinds of things shine the light on very specific things; in this case, the use of hadoop for security intelligence. What does that even mean? How does it work? People seem to not really care, but only hear the big words.
Here is a quick side-note or anecdote. After the big data panel, a friend of mine comes up to me and tells me that the audience asked the panel a question about how analytics played into the big data environment. The panel huddled, discussed, and said: “Ask Raffy about that“.
Back to the problem. I have been reading a bunch lately about SIEM being replaced or superseded by big data infrastructure. That’s completely and utterly stupid. These are not competing technologies. They are complementary. If anything, SIEM will be replaced by some other analytical capabilities that are leveraging big data infrastructures. Big data is like RDBMS. New analytical capabilities are like the SIEMs (correlation rules, parsed data, etc.) For example, using big data, who is going to write your parsers for you. SIEMs have spent a lot of time and resources on things like parsers, big data solutions will need to do the same! Yes, there are a couple of things that you can do with big data approaches and unparsed data. However, most discussions out there do not discuss those uses.
In the context of big data, people also talk about leveraging multiple data sources and new data sources. What’s the big deal? We have been talking about that for 6 years (or longer). Yes, we want video feeds, but how do you correlate a video with a firewall log? Well, you process the video and generate events from it. We have been doing that all along. Nothing new there.
What HAS changed is that we now have the means to store and process the data; any data. However, nobody really knows how to process it.
Let’s start focusing on analytics!
January 8, 2012
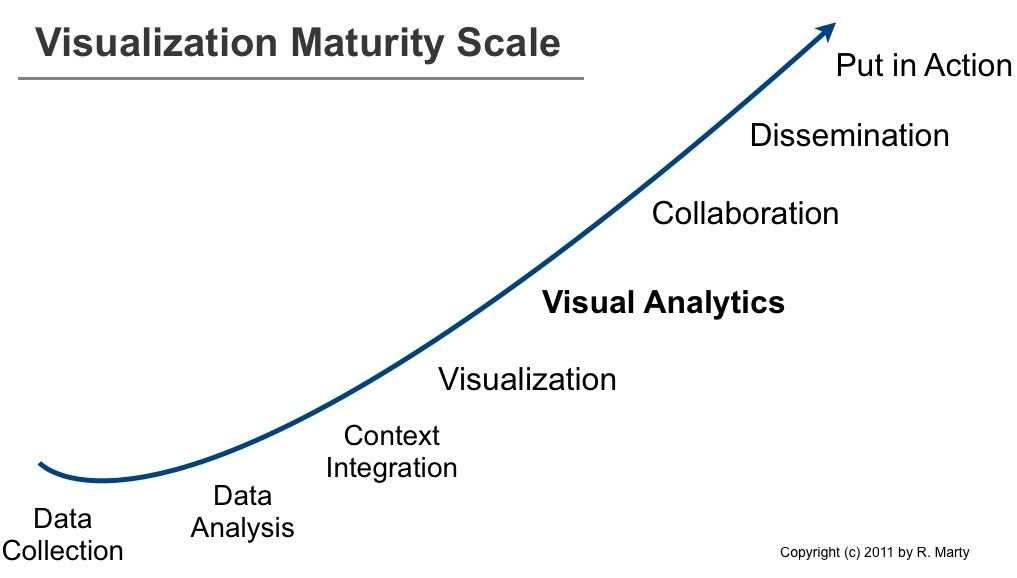
The visualization maturity scale can be used to explain a number of issues in the visual analytics space. For example, why aren’t companies leveraging visualization to analyze their data? What are the requirements to implement visual analytics services? Or why don’t we have more visual analytics products?
About three years ago I posted the log management maturity scale. The maturity scale helped explain why companies and products are not as advanced as they should be in the log management, log analysis, and security information management space.
While preparing my presentation for the cyber security grand challenge meeting in early December, I developed the maturity scale for information visualization that you can see above.
Companies that are implementing visualization processes move from through each of the steps from left to right. So do product companies that build visualization applications. In order to build products on the right-hand side, they need to support the pieces to the left. Let’s have a look at the different stages in more detail:
- Data Collection: No data, no visuals (see also Where Data Analytics and Security Collide). This is the foundation. Data needs to be available and accessible. Generally it is centralized in a big data store (it used to be relational databases and that’s a viable solution as well). This step generally involves parsing data. Turning unstructured data or semi-structured data into structured data. Although a fairly old problem, this is still a huge issue. I wonder if anyone is going to come up with a novel solution in this space anytime soon! The traditional regular expression based approach just doesn’t scale.
- Data Analysis: Once data is centralized or accessible via a federated data store, you have to do something with it. A lot of companies are using Excel to do the first iteration of data analysis. Some are using R, SAS, or other statistics and data analytics software. One of the core problems here is data cleansing. Another huge problem is understanding the data itself. Not every data set is as self explanatory as sales data.
- Context Integration: Often we collect data, analyze it, and then realize that the data doesn’t really contain enough information to understand it. For example in network security. What does the machine behind a specific IP address do? Is it a Web server? This is where we start adding more context: roles of machines, roles of users, etc. This can significantly increase the value of data analytics.
- Visualization: Lets be clear about what I refer to as visualization. I am using visualization to mean reporting and dashboards. Reports are static summaries of historical data. They help communicate information. Dashboards are used to communicate information in real-time (or near real-time) to create situational awareness.
- Visual Analytics: This is where things are getting interesting. Interactive interfaces are used as a means to understand and reason about the data. Often linked views, brushing, and dynamic queries are key technologies used to give the user the most freedom to look at and analyze the data.
- Collaboration: It is one thing to have one analyst look at data and apply his/her own knowledge to understand the data. It’s another thing to have people collaborate on data and use their joint ‘wisdom’.
- Dissemination: Once an analysis is done, the job of the analyst is not. The newly found insights have to be shared and communicated to other groups or people in order for them to take action based on the findings.
- Put in Action: This could be regarded as part of the dissemination step. This step is about operationalizing the information. In the case of security information management, this is where the knowledge is encoded in correlation rules to catch future instances of the same or similar incidents.
For an end user, the visualization maturity scale outlines the individual steps he/she has to go through in order to achieve analytical maturity. In order to implement the ‘put in action’ step, users need to implement all of the steps on the left of the scale.
For visualization product companies, the scale means that in order to have a product that lets a user put findings into action, they have to support all the left-hand stages: there needs to be a data collection piece; a data storage. The data needs to be pre-analyzed. Operations like data cleansing, aggregation, filtering, or even the calculation of certain statistical properties fall into this step. Context is not always necessary, but often adds to the usefulness of the data. Etc. etc.
There are a number of products, both open source, as well as commercial solutions that are solving a lot of the left hand side problems. Technologies like column-based data bases (e.g., MongoDB) or map reduce (e.g., Hadoop), or search engines like ElasticSearch are great open source examples of such technologies. In the commercial space you will find companies like Karmaspehre or DataMeer tackling these problems.
Comments? Chime in!
December 8, 2011
At the beginning of this week, I spent some time with a number of interesting folks talking about cyber security visualization. It was a diverse set of people from the DoD, the X Prize foundation, game designers, and even an astronaut. We all discussed what it would mean if we launched a grand challenge to improve cyber situational awareness. Something like the Lunar XPrize that is a challenge where teams have to build a robot and successfully send it to the moon.
There were a number of interesting proposals that came to the table. On a lot of them I had to bring things back down to reality every now and then. These people are not domain experts in cyber security, so you might imagine what kind of ideas they suggested. But it was fun to be challenged and to hear all these crazy ideas. Definitely expanded my horizon and stretched my imagination.
What I found interesting is that pretty much everybody gravitated towards a game-like challenge. All the way to having a game simulator for cyber security situational awareness.
Anyways, we’ll see whether the DoD is actually going to carry through with this. I sure hope so, it would help the secviz field enormously and spur interesting development, as well as extend and revitalize the secviz community!
Here is the presentation about situational awareness that I gave on the first day. I talked very briefly about what situational awareness is, where we are today, what the challenges are, and where we should be moving to.
September 13, 2011
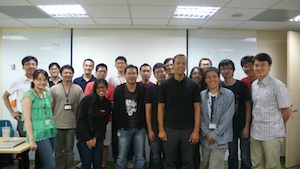 I just returned from Taipei where I was teaching log analysis and visualization classes for Trend Micro. Three classes a 20 students. I am surprised that my voice is still okay after all that talking. It’s probably all the tea I was drinking.
The class schedule looked as follows:
Day 1: Log Analysis
- data sources
- data analysis and visualization linux (davix)
- log management and siem overview
- application logging guidelines
- log data processing
- loggly introduction
- splunk introduction
- data analysis with splunk
Day 2: Visualization
- visualization theory
- data visualization tools an libraries
- perimeter threat use-cases
- host-based data analysis in splunk
- packet capture analysis in splunk
- loggly api overview
- visualization resources
 The class was accompanied by a number of exercises that helped the students apply the theory we talked about. The exercises are partly pen and paper and partly hands-on data analysis of sample logs with the davix life CD.
I love Taipei, especially the food. I hope I’ll have a chance to visit again soon.
PS: If you are looking for a list of visualization resources, they got moved over to secviz.
September 8, 2011
 Analyzing log files can be a very time consuming process and it doesn’t seem to get any easier. In the past 12 years I have been on both sides of the table. I have analyzed terabytes of logs and I have written a lot of code that generates logs. When I started writing Loggly’s middleware, I thought it was going to be really easy and fun to finally write the perfect application logs. Guess what, I was wrong. Although I have seen pretty much any log format out there, I had the hardest time coming up with a decent log format for ourselves. What’s a good log format anyways? The short answer is: “One that enables analytics or actions.”
I was sufficiently motivated to come up with a good log format that I decided to write a paper about application logging guidelines. The paper has two main parts: Logging Guidelines and a reference architecture for a cloud service. In the first part I am covering the questions of when to log, what to log, and how to log. It’s not as easy as you might think. The most important thing to constantly keep in mind is the use of the logs. Especially for the question on what to log you need to keep the log consumer in mind. Are the logs consumed by a human? Are they consumed by a log management tool? What are the people looking at the logs trying to do? Debugging the application? Monitoring performance? Detecting security violations? Depending on the answers to these questions, you might change the places in your code that you emit log records. (Or even better you log in all places and add a use-case indicator as a field to your logs.)
The paper is a starting point and not a definite guide. I would expect readers to challenge it and come up with improvements and refinements of use-cases and also the exact contents of the log records. I’d love to hear from practitioners and get a dialog going.
As a side note: CEE, the Common Event Expression standard, covers parts of what I am talking about in the paper. However, the paper’s focus is mainly on defining guidelines for application developers; establishing a baseline of when log entries should be recorded and what information should be included.
Resources: Cloud Application Logging for Forensics – Paper – Presentation
February 14, 2011
I wanted to post this review of the ‘draft-cloud-log-00‘ for a while now. Here it finally goes. In short, there is no need for a cloud-logging standard, but a way to deal with virtualization use-cases, ideally as part of another logging standard, such as CEE.
The cloud-log-00 draft is meant to define a standard around a logging format that can be used to correlate messages generated on different physical or virtual machines but belonging to the same ‘user request’. The main contribution of the current draft proposal is that it adds a structured element to a syslog (RFC 5424) messages. It outlines a number of IDs that can be and should be used for this purpose.
This analysis of the proposed draft outlines a number of significant shortcomings of the current draft-cloud-log-00 and motivates why it is a bad idea to pursue this or any other cloud logging standard any further. I urge the working group and IEFT to not move forward with this draft, but join forces with other standards, such as CEE (cee.mitre.org) and make sure that any special requirements or use-cases can be handled with such.
Following is a more detailed analysis of the draft proposal. I am starting with a generic analysis of the necessity for such a standard and how this draft positions itself:
- Section 3.2 outlines the motivation and objective for the proposed standard. The section outlines the problem of attributing ‘user requests’ to physical machine instances. This is not a problem that is unique to cloud installations. It’s a problem that was introduced through virtualization. The section misses to mention a real challenge and use-case for defining a cloud-based logging standard.
- The motivation, if loosely interpreted, talks about operational and security challenges because of a lack of information in the logs, which leads to problems of attribution (see last paragraph). The section fails to identify supporting use-cases that link the draft and proposed solution to the security and operational challenges. More detail is definitely needed here. The draft suggest the introduction of user IDs to (presumably) solve this problem. What is the relationship between the two? [See below where I argue that something like a guest ID or a hypervisor ID is needed to identify the individual components]
- One more detail about section 3.2. It talks about how operating system (“Linux or Windows VMs”) log files will very likely be irrelevant since one cannot tie those logs to the physical entities. This is absolutely not true. Why would one need to be able to tie these logs to physical machines? If the virtual CPU runs at 100%, that is a problem. No need to relate that back to the physical hardware. It’s irrelevant. A discussion of layers (see below) would help a lot here and it would show that the stated problems are in fact non existent. Also, why would I need to know how many users (including their roles) [quote from the draft] share the same hardware? What does that matter? I can rely completely on my virtual instances and plan load accordingly!
- The proposal needs to differentiate different layers of information, which correlate with different layers where logs can be generated. There is the physical layer, the virtualization layer which is generally also called the hypervisor, then there is the guest operating system and then there are applications running inside of the guest operating system. The proposal does not mention any of these layers and does not outline how these layers interact. Especially with regards to sharing IDs across these layers, a discussion is needed. The layered model would also help to identify real problems and use-cases, which the draft fails to do.
- The proposal omits to define the ‘cloud’ completely, although it is used in the title of the draft. It is not clear whether SaaS, PaaS, or IaaS is the target of this draft. If all of the above, there should be a discussion of such, which includes how the information is shared in those environments (the IDs).
Following is a more detailed analysis and questions about the proposed approach by using various IDs to track requests:
- If an AID was useful, which the draft still has to motivate, how is that ID passed between different layers in the application stack? Who generates it? How does it help solve the initially stated problem of operational and security related visibility and accountability? What is being used today in many applications is the UNIQUE_ID that can be generated by a Web server when receiving the request (see Apache UNIQUE_ID). That value can then be passed around. However, operating system resources and log entries cannot be tied uniquely to an application request. OS resources are generally shared across applications and it is not possible to attribute them to a specific application, or request. The proposed approach of using an AID is not a solution for the initially stated problem.
- Section 3.1 outlines a generic problem statement for log management. Why is this important for this draft? There is no relationship to the rest of the draft. In addition, the section talks about routers, firewalls, network devices, applications, etc. How are you suggesting these devices share a common ID? There needs to be a protocol to exchange these IDs or you need a way to generate the IDs based on request attributes. I do not see any discussion of this in the draft. A router will definitely not include such an ID. The processing needed is way to expensive and would likely need application layer parsing to do so. Again, the problem statement needs rewriting and rethinking.
- What is the transit field (Section 4.2)? It is not motivated, nor discussed anywhere.
- In general, it seems like the proposed set of fields are a random collection of such. How do we know that there are not more important fields that are missing? And what guarantees that the existing fields are good candidates to solve the stated problem (again, the draft needs to outline a real problem it is trying to solve. What is stated in the current draft is not sufficient).
- The client entity (Section 4.2.1) is being defined as either an IP address or a FQDN. From a consumer’s perspective, this can be very troublesome. If in some cases a FQDN is logged and in others an IP, in order to correlate the two entities, a DNS lookup has to be performed. If this happens at the time of correlation and not at the time of log generation, the IP to FQDN mapping might have changed. This could result in a false correlation of two not related events!
I would like to point out that the ‘cloud’, be that SaaS, PaaS, or IaaS, does not require a new logging standard! We had multi-tier, as well as virtualized architectures for years and they are the real building blocks of the ‘cloud’. None of the cloud-specific attributes, like elasticity, utility-based payment, etc. require anything specific from a logging point of view. If anything, we need a logging standard that can help with virtualized and highly asynchronous, and distributed architectures. But these are not issues that a logging standard should have to deal with. It’s the infrastructure that has to make these trackers or IDs available. For a complete logging standard, have a look at CEE, where multiple different building blocks are being put in place to solve all kinds of well motivated problems associated with interchange of messages, which result in log records.
I urge to not move ahead with anything like a cloud-logging standard. The cloud is nothing special. Rather should CEE (cee.mitre.org) be leveraged and possibly extended to take into account virtualization use-cases. This draft has a lot of logical flaws, motivational shortcomings, and a lot of inconsistencies. What is needed is communication capabilities and standards that help extract and exchange information between the different layers in the application or cloud stack. The application should be able to get information on which guest it is running in (something like a guest ID) and the machine it runs on. That way, visibility is created. However, this has nothing to do with a logging standard!
January 17, 2011
The last couple of months have been pretty busy. I have been really bad about updating my personal blog here, but I have not been lazy. Among other things, I have been traveling a lot to attend a number of conferences. Here is a little summary of what’s been going on:
- I posted a blog entry on secviz about my security visualization predictions for 2011. It’s a bit of a gloomy forecast, but check it out.
- The Security visualization predictions post was motivated by a panel I was on at the SANS Incident Detection Summit in D.C. early December. Here are the slides for my panel discussion.
- One of the topics I have been talking about lately is Cloud Security. The slides linked here are from a presentation I gave in Mexico.
- The topic of cloud security and also cloud risk management is one that I have been discussing on my new blog over at Infoboom.
- I have recorded a couple of pod casts in the last months also. One was the CloudChaser podcast where we talked about Logging Challenges and Logging in the Cloud.
- The other pod cast I recorded was together with Kord and Gary for The Cloud Computing Show. We talked about all kinds of things. Mainly about Loggly and logging in the cloud. Here the mp3.
- I also dug out the log maturity scale again. After mentioning it at the SANS logging summit, I got a lot of great responses on it.
- The other day, one of my Google alerts surfaced this DefCon video of me talking about security visualization. It’s probably one of my first conference appearances. Is it?
- And finally, 2011 started with a trip to Kauai where I presented a paper on insider threat visualization. Unfortunately, the paper is not publicly available. Email me if you want a copy.
As you are probably aware, you find my speaking schedule and slides on my personal page. That’s a good way of tracking me down. And in case you haven’t found it yet, I have a slideshare account where I try to share my presentations as well.
January 7, 2011
November 11, 2010
It’s been a while since I wrote “Applied Security Visualization“. Here is an older video that I just came about. A good overview of the book. Enjoy!
November 8, 2010
It’s time for a quick re-hash of recent publications and happenings in my little logging world.
- First and foremost, Loggly is growing and we have around 70 users on our private beta. If you are interested in testing it out, signup online and email or tweet me.
- I recorded two pod casts lately. The first one was around Logging As A Service. Check out my blog post over on Loggly’s blog to get the details.
- The second pod cast I recorded last week on the topic of business justification for logging. This is part of Anton Chuvakin’s LogCast series.
- I have been writing a little lately. I got three academic papers accepted at conferences. The one I am most excited about is the Cloud Application Logging for Forensics one. It is really applicable to any application logging effort. If you are developing an application, you should have a look at this. It talks about logging guidelines, a logging architecture and gives a bunch of very specific tips on how to go about logging. The other two papers are on insider threat and visualization: “Visualizing the Malicious Insider Threat”
- I will have some new logging and visualization related resources available soon. I am going to be speaking at a number of conferences in the next month: Congreso Seguridad en Computo 2010 in Mexico City, DeepSec 2010 in Vienna, and the SANS WhatWorks in Incident Detection and Log Management Summit 2010 in D.C.
See you next time.