I have discussed the topic of logging standards multiple times on this blog. Some recent developments in the logging space urged me to give an update and provide my opinion:
Yet another vendor just released a “standard” log format (note the quotes around standard). It’s called UCF, the Universal Collection Framework™ (UCF). This is how the vendor describes it:
UCF is the first WAN-aware, store-and-forward, encrypted, compressed IT data transport. It allows customers to gather IT data, increase resilience, reduce network chatter and encrypt from almost any device, anywhere, quickly and easily. UCF leverages a new transport and store protocol that LogLogic intends to open source in the near future.
Sounds a whole lot like syslog. (syslog-ng and rsyslog seem to support exactly this!) Okay, let’s just look at this description: WAN aware? What the heck is that supposed to mean? You mean it won’t work well on a LAN? Does that mean it knows the Internets? That’s just a strange description to start with. Oh, and it’s the first property mentioned! The rest of the description sounds like a transport protocol. Interesting. Why not stick with syslog that is well known, has proven to work, and has integration libraries built already. I never understood why vendors implemented their own transport protocols. They are hard (very hard) to implement and even harder for producers and consumers to adopt to. Oh well.
When people talk about UCF, they keep bringing up ArcSight’s CEF. Well, I am greatly responsible for that specification. But guess what? It’s not a transport protocol! It’s a syntax definition. It tells a log producer how to format their log file. Not how to transport it. Because, there is always syslog that a lot of machines have installed already and it’s easy to use. (And in newer versions you get encryption, caching, etc.).
Now, my last point about standards. Why do vendors keep trying to come up with standards by themselves? It just doesn’t make any sense. How is going to adapt it? At ArcSight, about 4 years ago, we came up with CEF because CEE didn’t move fast enough and we wanted something that our partners could easily use. An analyst wrote that ArcSight is planning to take CEF to the IETF. I hope they are not going to do that. I don’t have any control over that anymore, but that would be stupid. We rather push CEE through IETF. If you have a chance, compare the CEE syntax proposal with CEF. Notice something? Yes. It’s very similar. Again, I might have had something to do with that. Anyways. Vendors should not define logging standards!
On a good note: CEE is moving forward and just released the architecture overview for public commentary. Check them out!
Last week I posted the introductionary video for a talk that I gave at Source Boston in 2008. I just found the entire video of that talk. Enjoy:
Talk by Raffael Marty:
With the ever-growing amount of data collected in IT environments, we need new methods and tools to deal with them. Event and Log Analysis is becoming one of the main tools for analysts to investigate and comprehend the state of their networks, hosts, applications, and business processes. Recent developments, such as regulatory compliance and an increased focus on insider threat have increased the demand for analytical tools to help in the process. Visualization is offering a new, more effective, and simpler approach to data analysis. To date, security visualization, has mostly failed to deliver effective tools and methods. This presentation will show what the New York Times has to teach us about effective visualizations. Visualization for the masses and not visualization for the experts. Insider Threat, Governance, Risk, and Compliance (GRC), and Perimeter Threat all require effective visualization methods and they are right in front of us – in the newspaper.
I was giving a talk at SOURCEBoston 2008. The topic this time was general visualization and what has gone wrong in security visualization in the past. I showed how we can learn and steal from other disciplines, in this case, the New York Times. The NYT has done some pretty fantastic work in the area of data visualization. Their interactive market map, for example, is a great way of exploring stock data. During the talk, I outlined some of the design principles that the NYT graphics department is using when they are designing their graphs: Show – Don’t Tell.
To start my presentation, I showed a little video about security visualization (see below).
A rehash of an old blog post from February 2008. I thought it would make sense to give a quick update on CEE and put the link to the public discussion archives here again:
Well well well… I get so many questions from people about CEE. Where is it at, when does it come out, what will it cover? To be honest, I don’t quite know. I have some answers. We have been working really hard on getting a syntax, and a taxonomy working draft written up. I think it’s more than just a working draft. It will be a really well thought through starting point for the final standard around log syntax and taxonomy. For years (I wish this wasn’t literal, but it is), we have been working on this now. Took quite some time to get everyone on the CEE board to run into the same direction. I can’t promise any timeline for publication, but I hope it’s close.
In the meantime, if you are interested in the public discussions around CEE, the public discussion archives are available online.
I have also been working on an application logging paper that I just submitted to USENIX. If you are interested in how we implemented logging at Loggly and want to look at the paper, drop me a line, maybe I will share it.
The following blog post was originally posted in December 2008. I updated it slightly to fit current times:
This following blog post has turned into more than just a post. It’s more of a paper. In any case, in the post I am trying to capture a number of concepts that are defining the log management and analysis market (as well as the SIEM or SEM markets).
Any company or IT department/operation can be placed along the maturity scale (see Figure 1). The further on the right, the more mature the operations with regards to IT data management. A company generally moves along the scale. A movement to the right does not just involve the purchase of new solutions or tools, but also needs to come with a new set of processes. Products are often necessary but are not a must.
The further one moves to the right, the fewer companies or IT operations can be found operating at that scale. Also note that the products that companies use are called log management tools for the ones located on the left side of the scale. In the middle, it is the security information and event management (SIEM) products that are being used, and on the right side, companies have to look at either in-house tools, scripts, or in some cases commercial tools in markets other than the security market. Some SIEM tools are offering basic advanced analytics capabilities, but they are very rudimentary. The reason why there are no security specific tools and products on the right side becomes clear when we understand a bit better what the scale encodes.
Figure 1: IT Data Management Maturity Scale.
The Maturity Scale
Let us have a quick look at each of the stages on the scale. (Skip over this if you are interested in the conclusions and not the details of the scale.)
Do nothing: I didn’t even explicitly place this stage on the scale. However, there are a great many companies out there that do exactly this. They don’t collect data at all.
Collecting logs: At this stage of the scale, companies are collecting some data from a few data sources for retention purposes. Sometimes compliance is the driver for this. You will mostly find things like authentication logs or maybe message logs (such as email transaction logs or proxy logs). The number of different data sources is generally very small. In addition, you mostly find log files here. No more specific IT data, such as multi-line applications logs or configurations. A new trend that we are seeing here is the emergence of the cloud. A number of companies are looking to move IT services into the cloud and have them delivered by service providers. The same is happening in log management. It doesn’t make sense for small companies to operate and maintain their own logging solutions. A cloud-based offering is perfect for those situations.
Forensics / Troubleshooting: While companies in the previous stage simply collect logs for retention purposes, companies in this stage actually make use of the data. In the security arena they are conducting forensic investigations after something suspicious was noticed or a breach was reported. In IT operations, the use-case is troubleshooting. Take email logs, for example. A user wants to know why he did not receive a specific email. Was it eaten by the SPAM filter or is something else wrong?
Save searches: I don’t have a better name for this. In the simplest case, someone saves the search expression used with a grep command. In other cases, where a log management solution is used, users are saving their searches. At this stage, analysts can re-use their searches at a later point in time to find the same type of problems again, without having to reconstruct the searches every single time.
Share searches: If a search is good for one analyst, it might be good for another one as well. Analysts at some point start sharing their ways of identifying a certain threat or analyze a specific IT problem. This greatly improves productivity.
Reporting: Analysts need reports. They need reports to communicate findings to management. Sometimes they need reports to communicate among each other or to communicate with other teams. Generally, the reporting capabilities of log management solutions are fairly limited. They are extended in the SEM products.
Alerting: This capability lives in somewhat of a gray-zone. Some log management solutions provide basic alerting, but generally, you will find this capability in a SEM. Alerting is used to automate some of the manual trouble-shooting that is done among companies on the left side of the scale. Instead of waiting for a user to complain that there is something wrong with his machine and then looking through the log files, analysts are setting up alerts that will notify them as soon as there are known signs of failures showing up. Things like monitoring free disk space are use-cases that are automated at this point. This can safe a lot of manual labor and help drive IT towards a more automated and pro-active discipline.
Collecting more logs and IT data: More data means more insight, more visibility, broader coverage, and more uses. For some use-cases we now need new data sources. In some cases it’s the more exotic logs, such as multi-line application logs, instant messenger logs, or physical access logs. In addition more IT data is needed: configuration files, host status information, such as open ports or running processes, ticketing information, etc. These new data sources enable a new and broader set of use-cases, such as change validation.
Correlation: The manual analysis of all of these new data sources can get very expensive and too resource intense. This is where SEM solutions can help automate a lot of the analysis. Uses like correlating trouble tickets with file changes, or correlating IDS data with operating system logs (Note that I didn’t say IDS and firewall logs!) There is much much more to correlation, but that’s for another blog post.
Note the big gap between the last step and this one. It takes a lot for an organization to cross this chasm. Also note that the individual mile-stones on the right side are drawn fairly close to each other. In reality, think of this as a log scale. These mile-stones can be very very far apart. The distance here is not telling anymore.
Visual analysis: It is not very efficient to read through thousands of log messages and figure out trends or patterns, or even understand what the log entries are communicating. Visual analysis takes the textual information and packages them in an image that conveys the contents of the logs. For more information on the topic of security visualization see Applied Security Visualization.
Pattern detection: One could view this as advanced correlation. One wants to know about patterns. Is it normal that when the DNS server is doing a zone transfer that you will also find a number of IDS alerts along with some firewall log entries? If a user browses the Web, what is the pattern of log files that are normally seen? Patter detection is the first step towards understanding an IT environment. The next step is to then figure out when something is an outlier and not part of a normal pattern. Note that this is not as simple as it sounds. There are various levels of maturity needed before this can happen. Just because something is different does not mean that it’s a “bad” anomaly or an outlier. Pattern detection engines need a lot of care and training.
Interactive visualization: Earlier we talked about simple, static visualization to better understand our IT data. The next step in the application of visualization is interactive visualization. This type of visualization follows the principle of: “overview first, zoom and filter, then details on demand.” This type of visualization along with dynamic queries (the next step) is incredibly important for advanced analysis of IT data.
Dynamic queries: The next step beyond interactive, single-view visualizations are multiple views of the same data. All of the views are linked together. If you select a property in one graph, the selection propagates to the others. This is also called dynamic queries. This is the gist of fast and efficient analysis of your IT data.
Anomaly detection: Various products are trying to implement anomaly detection algorithms in order to find outliers, or anomalous behavior in the IT environment. There are many approaches that people are trying to apply. So far, however, none of them had broad success. Anomaly detection as it is known today is best understood for closed use-cases. For example, NBADs are using anomaly detection algorithms to flag interesting findings in network flows. As of today, nobody has successfully applied anomaly detection across heterogeneous data sources.
Sharing views, patterns, and outliers: The last step on my maturity scale is the sharing of advanced analytic findings. If I know that certain versions of the Bind DNS server tend to trigger a specific set of Snort IDS alerts, it is something that others should know as well. Why not share it? Unfortunately, there are no products that allow us to share this knowledge.
While reading the maturity scale, note the gaps between the different stages. They signify how quickly after the previous step a new step sets in. If you were to look at the scale from a time-perspective, you would start an IT data management project on the left side and slowly move towards the right. Again, the gaps are fairly indicative of the relative time such a project would consume.
Related Quantities
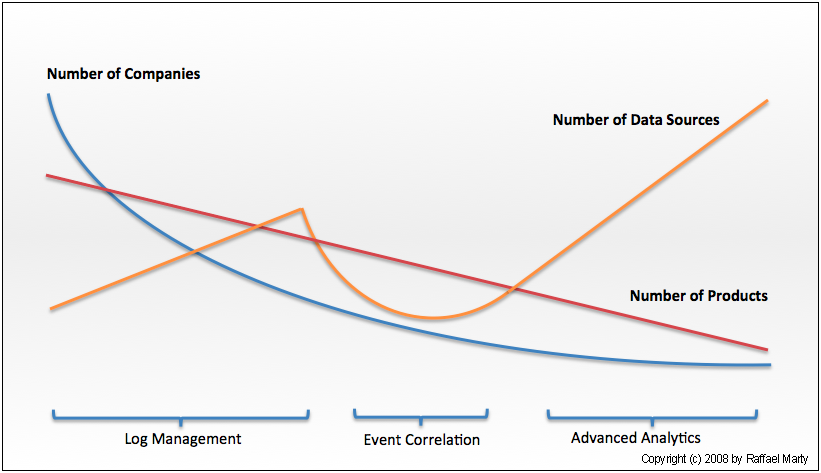
The scale could be overlaid with a lines showing some interesting, related properties. I decided to not do so in favor of legibility. Instead, have a look at Figure 2. It encodes a few properties: number of products on the market, number of customers / users, and number of data sources needed at that state of maturity.
Figure 2: The number of product, companies, and data sources tat are used / available along the maturity scale.
Why are so few products on the right side of the scale? The most obvious reason is one of market size. There are not many companies on the right side. Hence there are not many products. It is sort of a chicken and an egg problem. If there were more products, there might be more companies using them – maybe. However, there are more reasons. One of them being that in order to get to the right side, a company has to traverse the entire scale on the left. This means that the potential market for advanced analytics is the amount of companies that linger just before the advanced analytics market itself. That market is a very small one. The next question would be why there are not more companies close to the advanced analytics stage? There are multiple reasons. Some of them are:
Not many environments manage to collect enough data to implement advanced analytics across heterogeneous data. Too many environments are stuck with just a few data sources. There are organizational, architectural, political, and technical reasons why this is so.
A lack of qualified people (engineers, architects, etc) is another reason. Not many companies have the staff that understands how to deal with all the data collected. Not many people understand how to interpret the vast amount of different data sources.
The effects of these phenomenon play yet again into the availability of products for the advanced analytics side of the scale. Because there are not many environments that actually collect a diverse set of IT data, companies (or academia) cannot conduct research on the subject. And if they do, they mostly get it wrong or capture just a very narrow use-case.
What Else Does the Maturity Scale Tell Us?
Let us have a look at some of the other things that we can learn from/should know about the maturity scale:
What does it mean for a company to be on the far right of the scale?
In-depth understanding of the data
Understanding of how to apply advanced analytics, such as visualization theory, anomaly detection, etc)
Baseline of the behavior in the organization’s environment (needed for example for anomaly detection)
Understanding of the context of the data gathered, such as what’s the network topology, what are the properties of the assets, etc.
Have to employ knowledgeable people. These experts are scarce and expensive.
Collecting all log data, which is hard!
What are some other preconditions to live on the right side?
A mature change management process
Asset management
IT infrastructure documentation
Processes to deal with the findings/intelligence from advanced analytics
A security policy that tells what is allowed and intended and what is not. (Have you ever put a sniffer on the network to see what traffic there is? Did you understand all of it? This is pretty much the same thing, you put a huge sniffer on your IT environment and try to explain everything. Wow!
Understand the environment to the point where questions like: “What’s really normal?” are answered quickly. Don’t be fooled. This is nearly impossible. There are so many questions that need to be answered, such as: “Is a DNS server that generates ICMP messages every now and then an anomaly? Is it a security problem? What is the payload of the ICMP message? Maybe an information leak?”
What’s the return on investment (ROI) for living on the right-side of the scale?
It’s just not clear!
Isn’t it cheaper to ignore than to discover?
What do you intend to find and what will you find?
So, what’s the ROI? It’s hard to measure, but you will be able to:
Detect problems earlier
Uncover attacks and policy violations quicker
Prevent information leaks
Reduce down-time of infrastructure and applications
Reduce labor of service desk and system administration
The other day I was searching for some articles that I wrote a while back. For the life of it, I couldn’t find them. I then remembered that I published those articles as blog posts on my fomer employer’s Web site. Well, they have been taken down in the meantime. Too bad, there was some good stuff in there.
I therefore decided that I would revive my old blog posts and post them here on my personal blog. I will try to update them instead of just blindly pasting them in here.
I hope you will find the content useful. The first piece on Monday is going to be one of my favorite posts on the “Maturity Scale for IT Data Management”. So long, have a good weekend.
Oh, and yes, I changed the look of the page a bit. The font was kind of small and the width was really narrow. Hope this makes it a bit easier to read posts here… As always, feedback welcome at @zrlram
I thought you might be interested in some blog posts that I have written lately. I have been doing quite a bit of work on Django and Web applications. That might explain the topics of my recent blog posts. Check them out.
Would love to hear from you if you have any comments. Either leave a comment on the blogs, or contact me via Twitter at @zrlram.
I am attending the RSA conference this week. The first session I attended was the Cloud Security Alliance (CSA) meeting. Reading some of the accompanying material and listening to some of the presentations and panels, I couldn’t help it but notice that the terms auditing and logging were all over.
Here is my attempt for an explanation of this. It seems that one of the reasons for this is the nature of the cloud. Think about it. You are in an environment where you don’t control much. You are in an environment where you cannot trust most of the infrastructure pieces. For example, if you are using AWS like we are doing at Loggly, you should generally not trust your AMIs (the OS images). Now, what do you do if you don’t trust someone? You observe them, you monitor them. That’s exactly what is and needs to happen in the cloud: You don’t trust the service. To mitigate this issue, you are going to monitor the service.
And to make this not just my explanation, here is what some panelists during the CSA meeting said:
“Loss of visibility in the cloud” – Scott Chasin, CTO McAfee SaaS Unit
“Lose control and still maintain accountability” – Ken Biery, Verizon Business.
Is the cloud the killer app for logging? And if that’s the case, how do you manage your logs in the cloud? There are hardly any cloud logging solutions out there. I think you see where I am going with this.
For the month of May, I am doing a guest blog on CISCO Subnet. I will be discussing various topics around data visualization. You should stop by and check it out. If you have any topics that you are interseted in, let me know as well.



 I have discussed the topic of logging standards multiple times on this blog. Some recent developments in the logging space urged me to give an update and provide my opinion:
 A rehash of an old blog post from February 2008. I thought it would make sense to give a quick update on CEE and put the link to the public discussion archives here again: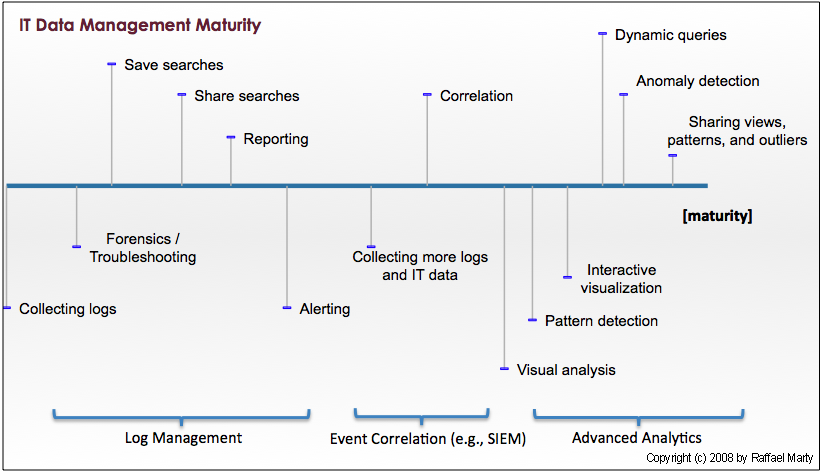




 For the month of May, I am doing a guest blog on