It’s already early March and the year is in full swing. Covid is still raging and we have been seeing some crazy weather patterns, especially in the south of the United States. While snowed in here in Texas, I took some time to reflect on what’s driving cyber security spend and customer focus this year. Overall, we can summarize the 2021 trends under the term of the “Unbound Enterprise“. You will see why when you look at the list of business drivers below. If you run a security business, you might want to see how your company caters to these trends and if you are in a role of protecting a company, ask yourself whether you are prepared for these scenarios:
Work from Home – The way that knowledge workers are doing their work has changed. For good. Most organizations, even after Covid, will allow their workforce to work from home. That brings with it an emphasize on things like endpoint security, secure remote access, and secure home infrastructure. The two big trends here from a market perspective are Secure Access Service Edge (SASE) and Zero Trust Network Access (ZTNA). Where the latter has initiated the long needed shift of focus to risk rather than event driven systems.
Supply Chain – Pretty much every product on the general markets is built from multiple supply sources; raw materials, specialized and integrated components. The production process is generally using tooling and machinery that is provided by another part of the supply chain. Think of third-party computer systems or MCU controlled infrastructure like HVACs, cloud infrastructures, and even external service personnel working on any of the infrastructure or processes of your company. Like most security challenges, securing the supply chain starts with visibility. Do you know which components are part of your supply chain? Who is the supplier and how trustworthy is said supplier?
SaaS Applications – Companies are moving more and more of their supporting infrastructure to third-party SaaS applications: Workday, Salesforce, Dropbox, even ERP systems are moving over to cloud services. Lower TCO, less maintenance headaches, etc. This means that not just backoffice services are moving to SaaS, but security product vendors also have to think about their product offerings and how they can provide SaaS enabled products to their customer base. Do it now. Do it today and not in three years when you have been pushed out of the market because you didn’t have a cloud offering.
Hybrid Infrastructures – Not all infrastructure will immediately move to the cloud. We will have to live through a time of hybrid infrastructures. The trend is for services to move into the cloud, but some things just cannot be moved yet for a myriad of reasons. This means that your security solutions probably have to support hybrid customer infrastructures for a while. Data centers won’t disappear over night. You can also get cyber incident response management so you have the ability to respond to cyber security incidents immediately. Nettitude explains why cyber security incident response is a big deal.
Insider Threat – Insider abuse is a concern. Do you know how many of your engineers are taking source code with them when they leave the company? Generally it’s not a malicious act, but there is a certain degree of ownership that a software developer feels toward the code that they wrote. Of course, legally, that code belongs to the company and it’s illegal for the developer to take the code with them, but go check what’s reality. This translates into any job role. In addition, espionage is on the rise. The good news is that if you protect your critical intellectual property (IP), you can fend off not just insiders, but also external attacks as their goal is primarily to steal, modify, or destroy your data.
Board of Directors Cyber Committees – The regulatory environment has been pushing boards to pay more attention to the company’s security practices and procedures. The board is liable for negligence on the security side. Therefore, many boards have started cyber committees that evaluate and drive the security practices of the organization. Gartner predicts that 40% of boards will have a dedicated cybersecurity committee by 2025. How can we help these committees do their job? How does your security product help with surfacing and reducing risk to the company in a measurable way?
I hope these themes help you guide your security (product) organizations for the next bit to come. I’ll leave all of you who think about security products with a final thought:
Attack vectors (threats) are constantly changing. New vulnerabilities are found and exploited, new technology stacks have to be secured, and humans keep making mistakes when configuring systems, securing their data, and are prone to social engineering. With these constantly moving targets, what are the constants that we can (have to) secure in order to escape the broken cycle of security?
I recently wrote a post about the concept of the Data Lakehouse, which in some ways, brings components of what I outlined in the first post around my desires for a new database system to life. In this post, I am going to make an attempt to describe a roll-up of some recent big data developments that you should be aware of.
Let’s start with the lowest layer in the database or big data stack, which in many cases is Apache Spark as the processing engine powering a lot of the big data components. The component itself is obviously not new, but there is an interesting feature that was added in Spark 3.0, which is the Adaptive Query Execution (AQE). This features allows Spark to optimize and adjust query plans based on runtime statistics collected while the query is running. Make sure to turn it on for SparkSQL (spark.sql.adaptive.enabled) as it’s off by default.
The next component of interest is Apache Kudu. You are probably familiar with parquet. Unfortunately, parquet has some significant drawbacks, like it’s innate batch approach (you have to commit written data before it’s available for read). Specifically when it comes to real-time applications. Kudu’s on-disk data format closely resembles parquet, with a few differences to support efficient random access as well as updates. Also notable is that Kudu can’t use cloud object storage due to it’s use of Ext4 or XFS and the reliance on a consensus algorithm which isn’t supported in cloud object storage (RAFT).
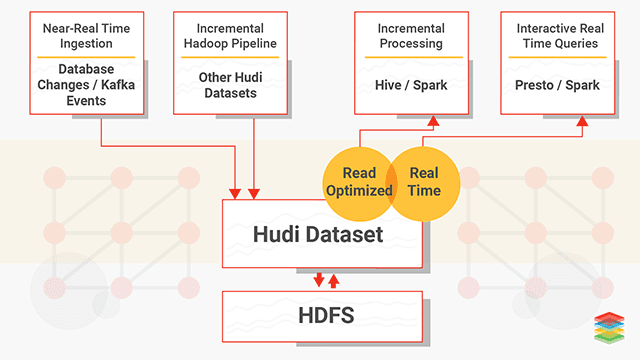
At the same layer in the stack as Kudu and parquet, we have to mention Apache Hudi. Apache Hudi, like Kudu, brings stream processing to big data by providing fresh data. Like Kudu it allows for updates and deletes. Unlike Kudu though, Hudi doesn’t provide a storage layer and therefore you generally want to use parquet as its storage format. That’s probably one of the main differences, Kudu tries to be a storage layer for OLTP whereas Hudi is strictly OLAP. Another powerful feature of Hudi is that it makes a ‘change stream’ available, which allows for incremental pulling. With that it supports three types of queries:
Snapshot Queries : Queries see the latest snapshot of the table as of a given commit or compaction action. Here the concepts of ‘copy on write’ and ‘merge on read’ become important. The latter being useful for near real-time querying.
Incremental Queries : Queries only see new data written to the table, since a given commit/compaction.
Read Optimized Queries : Queries see the latest snapshot of table as of a given commit/compaction action. This is mostly used for high speed querying.
The Hudi documentation is a great spot to get more details. And here is a diagram I borrowed from XenoStack:
What then is Apache Iceberg and the Delta Lake then? These two projects yet another way of organizing your data. They can be backed by parquet, and each differ slightly in the exact use-cases and how they handle data changes. And just like Hudi, they both can be used with Spark and Presto or Hive. For a more detailed discussion on the differences, have a look here and this blog walks you through an example of using Hudi and Delta Lake.
Enough about tables and storage formats. While they are important when you have to deal with large amounts of data, I am much more interested in the query layer.
The project to look at here is Apache Calcite which is a ‘data management framework’ or I’d call it a SQL engine. It’s not a full database mainly due to omitting the storage layer. But it supports multiple storage engines. Another cool feature is the support for streaming and graph SQL. Generally you don’t have to bother with the project as it’s built into a number of the existing engines like Hive, Drill, Solr, etc.
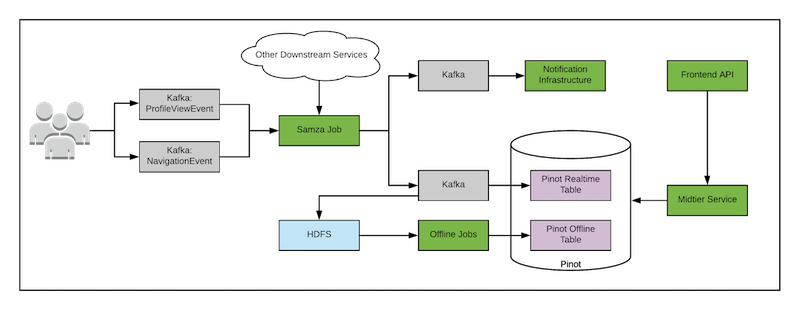
As a quick summary and a slightly different way of looking at why all these projects mentioned so far have come into existence, it might make sense to roll up the data pipeline challenge from a different perspective. Remember the days when we deployed Lambda architectures? You had two separate data paths; one for real-time and one for batch ingest. Apache Flink can help unify these two paths. Others, instead of rewriting their pipelines, let developers write the batch layer and then used Calcite to automatically translate that into the real-time processing code and to merge the real-time and batch outputs, used Apache Pinot.
The nice thing is that there is a Presto to Pinot connector, allowing you to stay in your favorite query engine. Sidenote: don’t worry about Apache Samza too much here. It’s another distributed processing engine like Flink or Spark.
Enough of the geekery. I am sure your head hurts just as much as mine, trying to keep track of all of these crazy projects and how they hang together. Maybe another interesting lens would be to check out what AWS has to offer around databases. To start with, there is PartiQL. In short, it’s a SQL-compatible query language that enables querying data regardless of where or in what format it is stored; structured, unstructured, columnar, row-based, you name it. You can use PartiQL within DynamoDB or the project’s REPL. Glue Elastic views also support PartiQL at this point.
Well, I get it, a general purpose data store that just does the right thing, meaning it’s fast, it has the correct data integrity properties, etc, is a hard problem. Hence the sprawl of all of these data stores (search, graph, columnar, row) and processing and storage projects (from hudi to parquet and impala back to presto and csv files). But eventually, what I really want is a database that just does all these things for me. I don’t want to learn about all these projects and nuances. Just give me a system that lets me dump data into it and answers my SQL queries (real-time and batch) quickly.
In my previous blog post, I ranted a little about database technologies and threw a few thoughts out there on what I think a better data system would be able to do. In this post, I am going to talk a bit about the concept of the Data Lakehouse.
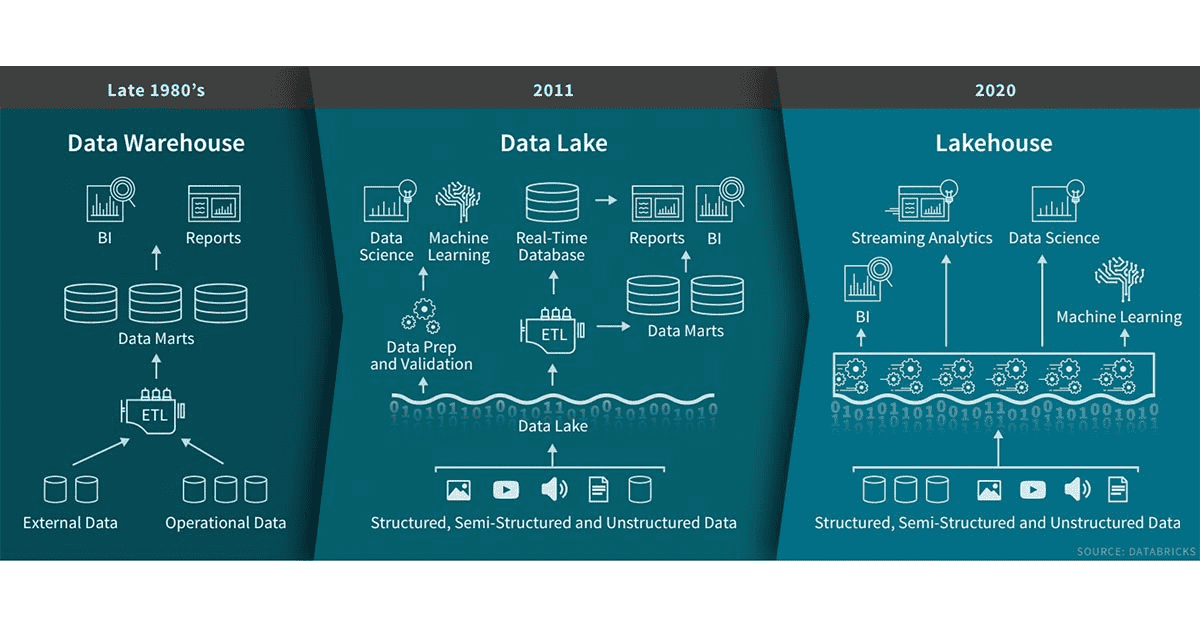
The term ‘data lakehouse‘ has been making the rounds in the data and analytics space for a couple of years. It describes an environment combining data structure and data management features of a data warehouse with the low-cost scalable storage of a data lake. Data lakes have advanced the separation of storage from compute, but do not solve problems of data management (what data is stored, where it is, etc). These challenges often turn a data lake into a data swamp. Said a different way, the data lakehouse maintains the cost and flexibility advantages of storing data in a lake while enabling schemas to be enforced for subsets of the data.
Let’s dive a bit deeper into the Lakehouse concept. We are looking at the Lakehouse as an evolution of the data lake. And here are the features it adds on top:
Data mutation – Data lakes are often built on top of Hadoop or AWS and both HDFS and S3 are immutable. This means that data cannot be corrected. With this also comes the problem of schema evolution. There are two approaches here: copy on write and merge on read – we’ll probably explore this some more in the next blog post.
Transactions (ACID) / Concurrent read and write – One of the main features of relational databases that help us with read/write concurrency and therefore data integrity.
Time-travel – This can feature is sort of provided through the transaction capability. The lakehouse keeps track of versions and therefore allows for going back in time on a data record.
Data quality / Schema enforcement – Data quality has multiple facets, but mainly is about schema enforcement at ingest. For example, ingested data cannot contain any additional columns that are not present in the target table’s schema and the data types of the columns have to match.
Storage format independence is important when we want to support different file formats from parquet to kudu to CSV or JSON.
Support batch and streaming (real-time) – There are many challenges with streaming data. For example the problem of out-of order data, which is solved by the data lakehouse through watermarking. Other challenges are inherent in some of the storage layers, like parquet, which only works in batches. You have to commit your batch before you can read it. That’s where Kudu could come in to help as well, but more about that in the next blog post.
If you are interested in a practitioners view of how increased data loads create challenges and how a large organization solved them, read about Uber’s journey that ended up in the development of Hudi, a data layer that supports most of the above features of a Lakehouse. We’ll talk more about Hudi in our next blog post.
In 2015, I wrote a book about the Security Data Lake. At the time, the big data space was not as mature as today and especially the intersection of big data and security wasn’t a well understood area. Fast forward to today, people are talking about to the “Data Lakehouse“. A new concept that has been made possible by new database technologies, projects, and companies pushing the envelope. All of which are trying to solve our modern data management and analytics challenges. Or said differently, they are all trying to make our data actionable at the lowest possible cost. In this first of three blog post, I am going to look at what happened in the big data world during the past few years. In the second blog post, we’ll explore what a data lakehouse is and we will look around to understand some of the latest big data projects and tools that promise to uncover the secrets hidden in our data.
Let me start with a bit of a rant about database technologies. Back in the day, we had relational databases; the MySQL’s and Oracle’s of the world. And the world was good. Then we realized that not all data and not all access patterns were suited for these databases, so we invented the document stores, the search engines, the graph databases, the key value stores, the columnar databases, etc. And that’s when life got complicated. What database do you use for what purposes? Often it seemed like we’d need multiple ones. But that would have meant we’d needed to duplicate data, pick the right database for the task at hand, synchronize the data, etc. A nightmare. What happened then was that we just started using the technology that seemed to cover most of our needs and abused it for the other tasks. I have seen one too many document stores used to serve complex analytical questions (i.e., asking Lucene to return aggregate metrics and ad-hoc summaries).
Alongside the database technologies themselves, there is a notable secondary trend: increased requirements from a regulatory, privacy, and data locality perspective. Regulations like GDPR are imposing restrictions and requirements on how data can be stored and give individuals the right to see their data and even modify or delete it upon request. Some data stores have come up with privacy features, which are often in harsh contradiction to the insights we are looking for in the data. Finally, with increasingly going global, it matters where we collect and process our data. Not just for privacy purposes, but rather for processing speed and storage requirements. How, for example, do you compute global summaries over your data? Do you bring the data into one data center? Or do you compute local aggregates to then summarize them? Latency and storage costs are important factors to consider.
Wouldn’t it be nice if we had a data system that took care of all the above mentioned requirements automatically? It ingests the data we send to it – structured, unstructured, sensitive, non sensitive, anything. And on the other side, we formulate queries (I think we should keep SQL as the lingua franca for this) to answer the questions we have. Of course, we can add nice visualization layers on top, but that’s icing on the cake. I’d love a self-adjusting system. Don’t make me choose whether I wanted a graph database or not. Don’t make me configure data localities or privacy parameters. Let the system determine the necessary parameters – maybe bring me in the loop for things that the system cannot figure out itself, but make it easy on me. Definitely don’t ask me to create indexes or views. Let the system figure out those properties on the fly, while observing my access patterns. Move the data to where it is needed, create summary tables and materialized views transparently, while keeping storage cost and regulatory constraints in mind.
Now that we talked about storage and access, what about ETL? The challenge with translating data on ingest is that the translation often means loss of information. On the flip side, it makes analytics tasks easier and it helps clean the data. Take security logs (syslog), for example. We could store them in their original form as an unstructured string, or we could parse out every element to store the individual fields in a structured way. The challenge is the parser. If we get things wrong, we will loose entire log records. If, however, we stored the logs in their original form, we could do the transformation (parsing) at the time of analytics. The drawback then being that we will parse the same data multiple times over; every time we query or run any analytics on it. What to do? Again, wouldn’t it be nice if the data system took care of this decision for us? Keep the original data around if necessary, parse where needed, re-parse on error, etc.
Let’s look at one final piece of the data system puzzle, analytics. With the advent of cloud, there has been a big push to centralize analytics. That means all the data has to be shipped to a single, central location. That in itself is not always cheap, nor fast. We need an approach that allows us to keep some data completely decentralized. Leave the data at the place of generation and use the compute there to derive partial answer. Only send around the data that is needed. Again, with all the constraints and requirements we might have, such as compute availability and cost, hybrid data storage, considerations of fail over, redundancy, backups, etc. And again, I don’t want to configure these things. I’d like the system to take care of them after I told it some guiding parameters.
In a future post I will explore what has happened in the last couple of years in the big data ecosystem and what the lakehouse is about. Is there maybe a solution out there that sufficiently satisfies the above requirements?
Building an AI Powered Intelligence Community (Click image for video)
Here is the list of topics I injected into the panel conversation:
Algorithms (AI) are Dangerous
Privacy by Design
Expert Knowledge over algorithms
The need for a Security Paradigm Shift
Efficacy in AI is non existent
The need for learning how to work interdisciplinary
Please not that I am following in the vein of the conference and I won’t define specifically what I mean by “AI”. Have a look at my older blog posts for further opinions. Following are some elaborations on the different topics:
Algorithms (AI) are Dangerous – We allow software engineers to use algorithms (libraries) for which they do not know what results are produced. There is no oversight demand – imagine the wrong algorithms being used to control any industrial control systems. Also realize that it’s not about using the next innovation in algorithms. When DeepLearning entered the arena, everyone tried to use it for their problems. Guess what; barely any problem could be solved by it. It’s not about the next algorithms. It’s about how these algorithms are used. The process around them. Interestingly enough, one of the most pressing and oldest problems that every CISO today is still wrestling with is ‘visibility’. Visibility into what devices and users are on a network. That has nothing to do with AI. It’s a simple engineering problem and we still haven’t solved it.
Privacy by Design – The entire conference day didn’t talk enough about this. In a perfect world, our personal data would never leave us. As soon as we give information away it’s exposed and it can / and probably will be abused. How do we build such systems?
Expert Knowledge – is still more important than algorithms. We have this illusion that AI (whatever that is), will solve our problems by analyzing data with the use of software systems that work with a cloud based database. Instead of using “AI” to augment human capabilities. In addition, we need experts who really understand the problems. Domain experts. Security experts. People with experience to help us build better systems.
Security Paradigm Shift – We have been doing security the wrong way. For two decade we have engaged in the security cat and mouse game. We need to break out of that. Only an approach of understanding behaviors can get us there.
Efficacy – There are no approaches to describing how well an AI system works. Is my system better than someone else’s? How do we measure these things?
Interdisciplinary Collaboration – As highlighted in my ‘expert point’ above; we need to focus on people. And especially on domain experts. We need multi-disciplinary teams. Psychologists, counter intelligence people, security analysts, systems engineers, etc. to collaborate in order to help us come up with solutions to combat security issues. There are dozens of challenges with these teams. Even just something as simple as terminology or a common understanding of the goals pursued. And this is not security specific. Every area has this problem.
The following was a fairly interesting thing that was mentioned during one of the other conference panels. This is a “non verbatum” quote:
AI is one of the poster children of bipartisanship. Ever want to drive bipartisanship? Engage on an initiative with a common economical enemy called China.
Oh, and just so I have written proof when it comes to it: China will win the race on AI! Contrary to some of the other panels. Why? Let me list just four thoughts:
No privacy laws or ethical barriers holding back any technology development
Availability of lots of cheap, and many of them, very sophisticated resources
The already existing vast and incredibly rich amount of data and experiences collected; from facial recognition to human interactions with social currencies
A government that controls industry
I am not saying any of the above are good or bad. I am just listing arguments.
Last week I was speaking on a panel about the “Use of AI for Cybersecurity” at the Intelligence and National Security Alliance (INSA) conference on “Building an AI Powered Intelligence Community”. It was fascinating to listen to some of the panels with people from the Hill talking about AI. I was specifically impressed with the really educated views on issues with AI, like data bias, ethical and privacy issues, bringing silicon valley software development processes to the DoD, etc. I feel like at least the panelists had a pretty good handle on some of the issues with AI.
The one point that I am still confused about is what all these people actually meant when they said “AI”; or how the “Government” defines AI.
I have been reading through a number of documents and reports from the US government, but almost all of them do not define what AI actually is. For example the American AI Initiative One Year Annual Report to the president doesn’t bother defining AI.
Artificial intelligence (AI) is one such technological advance. AI refers to the ability of machines to perform tasks that normally require human intelligence – for example, recognizing patterns, learning from experience, drawing conclusions, making predictions, or taking action – whether digitally or as the smart software behind autonomous physical systems.
Seems to me that this definition could use some help. NIST on their AI page doesn’t have a definition front and center. And the documents I browsed through didn’t have one either.
Sec. 9. Definitions. As used in this order:
(a) the term “artificial intelligence” means the full extent of Federal investments in AI, to include: R&D of core AI techniques and technologies; AI prototype systems; application and adaptation of AI techniques; architectural and systems support for AI; and cyberinfrastructure, data sets, and standards for AI;
I would call this a circular definition? Or what do you call this? A non-definition? Maybe I have focused on the wrong documents? What about the definition of AI by the Joint Artificial Intelligence Center (JAIC). a group within the DoD? The JAIC Web site does not seem to have a definition, at least not one I could find.
One document that seems to get it is the Artificial Intelligence and National Security report, which has an entire section discussing the different aspects of AI and what they mean by the acronym.
In closing, if we have policy, legislative, or regulatory conversation, we must define what AI is. Otherwise we have conversations that go into the absolutely wrong directions. Does 5G fall under AI? How about NLP or automating the transcription of a conference presentation? If we don’t get clear, we will write legislation and put out bills that do not cover the technologies and approaches we actually want to govern but will put roadblocks into the path of innovation and the so fiercely sought after dominance in AI.
I was just reading an article from Forrester research about “Artificial Intelligence Is Transforming Fraud Management”. Interesting read until about half way through where the authors start talking about supervised and unsupervised learning. That’s when they lost a lot of credibility:
Supervised learning makes decisions directly. Several years ago, Bayesian models, neural networks, decision trees, random forests, and support vector machines were popular fraud management algorithms. (see endnote 8) But they can only handle moderate amounts of training data; fraud pros need more complex models to handle billions of training data points. Supervised learning algorithms are good for predicting whether a transaction is fraudulent or not."
Aside from the ambiguity of what it means for an algorithm to make ‘direct’ decisions, SML can only take limited amounts of training data? Have you seen our malware deep learners? In turn, if SML is good at predicting fraudulent transaction, what’s the problem with training data?
What do they say about unsupervised approaches?
Unsupervised learning discovers patterns. Fraud management pros employ unsupervised learning to discover anomalies across raw data sets and use self-organizing maps and hierarchical and multimodal clustering algorithms to detect swindlers. (see endnote 10) The downside of unsupervised learning is that it is usually not explainable. To overcome this, fraud pros often use locally interpretable, model-agnostic explanations to process results; to improve accuracy, they can also train supervised learning with labels discovered by unsupervised learning. Unsupervised learning models are good at visualizing patterns for human investigators.
And here it comes: “The downside of UML is that it is usually not explainable”. SML is much more prone to that problem than UML. Please get the fundamentals right. Reading something like this makes me question pretty much the entire article on its accuracy. There are some challenges with explainability and UML, but they are far less involed.
As a further nuance: “UML is not itself good at visualizing patterns. Some of the algorithms lend themselves to visualize the output. But there is more to turning a clustering algo into a good visual. I mention t-sne in one of my older blog posts. That algorithm actually follows an underlying visualization paradigm (projection of multiple dimensions into two or three dimensions).
Reading on in the article, it says:
As this use case requires exceptional performance and accuracy, supervised learning dominates.
I thought SML doesn’t scale? Turns out, it actually does quite well, not least because you can run a learner offline.
This paper highlights the problem of needing domain experts to build machine learning approaches for security. You cannot rely on pure data scientists without a solid security background or at least a very solid understanding of the domain, to build solutions. What a breath of fresh air. I hole heartedly agree with this. But let’s look at how the authors went about their work.
The example that is used in the paper is in the area of malware detection; a problem that is a couple of decades old. The authors looked at binaries as byte streams and initially argued that we might be able to get away without feature engineering by just feeding the byte sequences into a deep learning classifier – which is one of the premises of deep learning, not having to define features for it to operate. The authors then looked at some adversarial scenarios that would circumvent their approach. (Side bar: I wish Cylance had read this paper a couple years ago). The paper goes through some ROC curves and arguments to end up with some lessons learned:
Training sets matter when testing robustness against adversarial examples
Architectural decisions should consider effects of adversarial examples
Semantics is important for improving effectiveness [meaning that instead of just pushing a binary stream into the deep learner, carefully crafting features is going to increase the efficacy of the algorithm]
Please tell me which of these three are non obvious? I don’t know that we can set the bar any lower for security data science.
I want to specifically highlight the last point. You might argue that’s the one statement that’s not obvious. The authors basically found that, instead of feeding simple byte sequences into a classifier, there is a lift in precision if you feed additional, higher-level features. Anyone who has looked at byte code before or knows a little about assembly should know that you can achieve the same program flow in many ways. We must stop comparing security problems to image or speech recognition. Binary files, executables, are not independent sequences of bytes. There is program flow, different ‘segments’, dynamic changes, etc.
We should look to other disciplines (like image recognition) for inspiration, but we need different approaches in security. Get inspiration from other fields, but understand the nuances and differences in cyber security. We need to add security experts to our data science teams!
Over the weekend I was catching up on some reading and came about the “Deep Learning and Security Workshop (DLS 2019)“. With great interest I browsed through the agenda and read some of the papers / talks, just to find myself quite disappointed.
It seems like not much has changed since I launched this blog. In 2005, I found myself constantly disappointed with security articles and decided to outline my frustrations on this blog. That was the very initial focus of this blog. Over time it morphed more into a platform to talk about security visualization and then artificial intelligence. Today I am coming back to some of the early work of providing, hopefully constructive, feedback to some of the work out there.
The researcher paper I am looking at is about building a deep learning based malware classifier. I won’t comment on the fact that every AV company has been doing this for awhile (but learned from their early mistakes of not engineering ‘intelligent’ features). I also won’t discuss the machine learning architecture that is introduced. What I will argue is the approach that was taken and the conclusions that were drawn:
The paper uses a data set that has no ground truth. Which, in network security is very normal. But it needs to be taken into account. Any conclusion that is made is only relative to the traffic that the algorithm was tested, at the time of testing and under the used configuration (IDS signatures). The paper doesn’t discuss adoption or changes over time. It’s a bias that needs to be clearly taken into account.
The paper uses a supervised approach leveraging a deep learner. One of the consequences is that this system will have a hard time detecting zero days. It will have to be retrained regularly. Interestingly enough, we are in the same world as the anti virus industry when they do binary classification.
Next issue. How do we know what the system actually captures and what it does not?
This is where my recent rants on ‘measuring the efficacy‘ of ML algorithms comes into play. How do you measure the false negative rates of your algorithms in a real-world setting? And even worse, how do you guarantee those rates in the future?
If we don’t know what the system can detect (true positives), how can we make any comparative statements between algorithms? We can make a statement about this very setup and this very data set that was used, but again, we’d have to quantify the biases better.
In contrast to the supervised approach, the domain expert approach has a non-zero chance of finding future zero days due to the characterization of bad ‘behavior’. That isn’t discussed in the paper, but is a crucial fact.
The paper claims a 97% detection rate with a false positive rate of less than 1% for the domain expert approach. But that’s with domain expert “Joe”. What about if I wrote the domain knowledge? Wouldn’t that completely skew the system? You have to somehow characterize the domain knowledge. Or quantify its accuracy. How would you do that?
Especially the last two points make the paper almost irrelevant. The fact that this wasn’t validated in a larger, real-world environment is another fallacy I keep seeing in research papers. Who says this environment was representative of every environment? Overall, I think this research is dangerous and is actually portraying wrong information. We cannot make a statement that deep learning is better than domain knowledge. The numbers for detection rates are dangerous and biased, but the bias isn’t discussed in the paper.
Before even diving into the topic of Causality Research, I need to clarify my use of the term #AI. I am getting sloppy in my definitions and am using AI like everyone else is using it, as a synonym for analytics. In the following, I’ll even use it as a synonym for supervised machine learning. Excuse my sloppiness …
Causality Research is a topic that has emerged from the shortcomings of supervised machine learning (SML) approaches. You train an algorithm with training data and it learns certain properties of that data to make decisions. For some problems that works really well and we don’t even care about what exactly the algorithm has learned. But in certain cases, we really would like to know what the system just learned. Your self-driving car, for example. Wouldn’t it be nice if we actually knew how the car makes decisions? Not just for our own peace of mind, but also to enable verifyability and testing.
Here are some thoughts about what is happening in the area of causality for AI:
This topic is drawing attention because people are having their blinders on when defining what AI is. AI is more than supervised machine learning, and a number of the algorithms in the field, like belief networks, are beautifully explainable.
We need to get away from using specific algorithms as the focal point of our approaches. We need to look at the problem itself and determine what the right solution to the problem is. Some of the very old methods like belief networks (I sound like a broken record) are fabulous and have deep explainability. In the grand scheme of things, only few problems require supervised machine learning.
We are finding ourselves in a world where some people believe that data can explain everything. It cannot. History is not a predictor of the future. Even in experimental physics, we are getting to our limits and have to start understanding the fundamentals to get to explainability. We need to build systems that help experts encode their knowledge and augments human cognition by automating tasks that machines are good at.
The recent Cylance faux pas is a great example why supervised machine learning and AI can be really really dangerous. And it brings up a different topic that we need to start exploring more, which is how we measure the efficacy or precision of AI algorithms. How do we assess the things a given AI or machine learning approach misses and what are the things it classifies wrong? How does one compute these metrics for AI algorithms? How do we determine whether one algorithm is better than another. For example, the algorithm that drives your car. How do you know how good it is? Does a software update make it better? How much? That’s a huge problem in AI and ‘causality research’ might be able to help develop methods to quantify efficacy.