April 20, 2009
 PixlCloud is my latest employer. I founded the company two weeks ago. It is going to be a company that offers a service in the cloud. The mission of the company is to build a data visualization SaaS. Users can submit their data to the service and then interactively visualize it. One of the cornerstones of the service is that anyone should be able to use it. You won’t have to be a visualization expert or an expert in data mining or alike.
I am gathering user input. If you feel like you have a need for such a data visualization service or you would like to offer your input for any aspect of my company, be that the market, the product, the users, marketing, product features, or really anything, drop me a line.
March 11, 2009
 Peter Kuper (@peterkuper), just gave the keynote at SOURCEBoston.
The Bad, The Ugly, and the Good
It looks bad out there. Unemployment is up, companies are going out of business, etc. Well, it had to happen. The economy has to clean itself. It’s a reset of the system. Do really need another car?
Let us look at some historic data. Past recessions were preceded by drops in software spending, except for this time. Software spending was actually growing. The reason for this being that software has been more and more positioned and understood to increase productivity, which is a really interesting development.
Is it getting any better? According to my friend, who runs a blog about this crypto app, the financial markets teach us that corporate IT spending follows personal consumer expenditures. The problem is that consumers don’t have money to spend and they are over-leveraged. There is just too much dept. This means that corporate expenditures will be down for a while until personal spending will pick up again. Another interesting fact about the security market is that there are too many vendors in the market place. We will see more failures and more acquisitions over the next years.
The good news is that there is opportunity. Cash is king. If you can pay cash, you will get a deal. You can leverage this fact in your favor. If you are an investor or you are dealing with investors, the thing to be aware of, is that they dictate the terms. Keep that in mind. For inventors, this market is an opportunity. There is a big need in many areas to help companies improve on their expenditures and optimize processes! Help companies be more competitive. Things like how they can safe power can result in actual measurable benefits. Where should you focus your inventions? Focus on software. Hardware spending is down year over year, while software is on the raise. In addition, investment in software has been fairly consistent across IT budgets. Another market data point, according to research by Arcules, is that security budgets are flat this year. They haven’t increased, but they have not decreased either. However, they might go down next year. What this means is that companies will have to do more with less. Leverage their existing investments better. [This was one of my security predictions for 2009 also. In addition, I think this is a great driver to get companies from the left hand side of the maturity scale over to the right-hand side. Doing more with what you have.]
To use the market to your advantage, you need to think about what you are doing to position yourself or your firm to be the one rocketing ahead of the curve. Also use the development on the stock markets to your advantage. Compare competitors and play them against each other. If you are intending to buy a product, use that information to make your case about why you want a discount.
What does all of the market development mean for Entrepreneurs? First of all, VCs need to keep their portfolios alive. They are giving more money to their portfolio companies, but generally less than they would in better times. Software is getting money. Great ideas still get money. If you are intending to start a company, it’s the best time right now. You are not missing out on the big upside. You are not dealing with any bad legacy. You have a clean slate. Keep an eye on being efficient from the beginning on. For example, don’t hire too many people to start with, but outsource or hire contractors. Manage every penny. Be careful with spending. Also think about how you position yourself. Are you planning the big bang? Or are you building for being acquired?
Planning today will pay huge dividends when things eventually do recover!
During the questions in the end, some comments were made that the banks didn’t understand how to manage risk. How does that affect IT security and IT risk management? Does IT security even matter to banks? Adam Shostack gave a great answer: “Banks know very well how to manage risk: They took all of the upside and wrote off the downside” But seriously, What it really comes down to is managing incentives for reducing risk. The right incentive system needs to pu in place.
February 17, 2009
 “Log Analysis and Security Visualization” is a two-day training class held on March 9th and 10th 2009 in Boston during the SOURCE Boston conference that addresses the data management and analysis challenges of today’s IT environments.
 Students will leave this class with the knowledge to visualize and manage their own IT data. They will learn the basics of log analysis, learn about common data sources, get an overview of visualization techniques, and learn how to generate visual representations of IT data for a number of different use-cases from DoS and worm detection to compliance reporting. The training is filled with hands-on exercises utilizing DAVIX, the open-source data analysis and visualization platform.
Register today to secure your spot.
January 15, 2009
Have you seen the book Applied Security Visualization on the shelf at your local book store? If so, send me a picture and I will post it…
My friend Jan spotted the book on November 28th at the Eason Bookshop on O’Connell St in Dublin:

January 5, 2009
 Richard Bejtlich rated Applied Security Visualization as the second best security book in 2008! Read more about the books Richard read at: Best Book Bejtlich Read in 2008. Thanks Richard!
[tags]applied security visualization, security, visualization, security books, books[/tags]
January 2, 2009
December 18, 2008
 I am really late to the game. But finally I read draft-ietf-syslog-protocol-23. This is the new draft for revising the syslog protocol.
Here are some of my comments that I also submitted officially:
- Let me say this first: I really like some of the changes that have been incorporated.
- Syslog message facility: Why still keeping this? The only reason that I see people using the facility is to filter messages. There are better ways to do that. Some of the pre-assigned groups are fairly arbitrary and not even really implemented in most OSs. UUCP subsystem? Who is still using that? I guess the reason for keeping it is backwards compatibility? If possible, I would really like this to be gone.
- Priority calculation: The whole priority field is funky. The priority does not really have any meaning. The order does not imply importance. Why having this at all?
- Timestamps: What’s the reason for having the “T” in the timestamp? Having looked at hundreds of different log formats, I have never seen anything like that. Why doing this?
- Hostname: I am not comfortable with the whole hostname spec. I like that there is an ordering and people are supposed to use FQDNs, but there are many questions about this. To start with, in a lot of UNIX configurations, /etc/hosts contains an entry like
127.0.0.1  localhost.localdomain localhost
The second column is the FQDN (technically). Is that one that can be used? Can you make it clear that this is not what should be used? Same for 127.0.0.1 or the loopback address in general. How does a machine know whether an IP address is static or dynamic? How does a logging application know? I don’t think you will ever know that. Did you mean a private versus a public address? That might be interesting. Furthermore, it should specify which interface’s IP address to use. The interface that the message is sent out on?
- Under the section of PROCID: The text is imprecise. This number is not the process ID of the syslog process, it’s the ID of the writing process. The third paragraph talks about detecting restarted applications and somehow mixes in the syslog process. (“might be assigned the same process ID as the previous syslog process“.) This is not clear at all and very very confusing.
- MSGID: Make clear that this ID is local to the application. It’s not a global ID at all.
The biggest issue I have around the SD-ID field:
- I like that the user can extend the set of registered IDs.
- Why is this structure so complicated? Why not going with a simple set of key-value pairs? This whole structure thing is so complicated. Parsing it, you need to keep state! You need to remember the SD-ID for each SD-PARAM. Why introducing this? Just stick with simple key-value pairs. That makes parsing easier. Much easier. And it makes the events easier to produce as well.
- By keeping an explicit message field (the unstructured part), you encourage people to still log in that way. I recommend using an explicit field (or parameter) that can be used to include human readable text. Instead of this:
<165>1 2003-08-24T05:14:15.000003-07:00 192.0.2.1 myproc 8710 - - %% It's time to make the do-nuts.
use:
<165>1 2003-08-24T05:14:15.000003-07:00 192.0.2.1 myproc 8710 - message="%% It's time to make the do-nuts."
or really:
1 2003-08-24 05:14:15.000003-07:00 host=192.0.2.1 process=myproc procid=8710 message="%% It's time to make the do-nuts."
- I definitely like the consideration of some of the special fields (structured data IDs). However, they should be used as simple keys (or parameters) that have special meaning.
- Parameter – origin: What does it mean to have multiple origins IPs? Is that a syslog forwarding chain? The document does not say anything about that. Also, we already have the host field in the beginning of the syslog messages. What’s the relationship to that? Or is origin something completely different?
- Parameters – I would really like to see some use-cases for all of the IDs. Especially the sequenceId. I am assuming this is something that the syslog daemon assigns, not the logging application. Right? I think that needs to be clearer. For the sequenceId, what happens for forwarded messages? Are these IDs local? Are they forwarded along with a message? Also, how does the logging application know about the timeQuality? Or if that something that the syslog daemon assigns, how does it know?
- I would really like to see the parameters to go away and have a generic key-value extension. In addition, IANA should have a set of allowed/defined keys. The parameters should be part of those. Each key has a special meaning (semantics). There should be a whole lot of them: src_ip, user_name, etc. Each producer should be free to add additional keys, realizing that not all consumers would understand their semantics. However, the consumers could still read them.
That’s it for now… Let’s see what some of the reactions are going to be.
[tags]IANA, syslog, syslog protocol, IETF, logging[/tags]
December 7, 2008
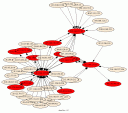 I have been using link graphs a lot in my work of visualizing security data. They are a great methods to display relationships between entities. I guess the most used link graph is one that shows communications of machines. The nodes represent the communicating machines and arrows connecting them show flows.
You can use color and shape to encode more information, such as the amount o traffic transmitted or a machine’s role. I even extended the graphs to show three types of nodes: source nodes, event nodes, and target nodes.

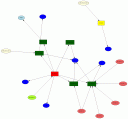
This lets me encode more information in a graph, such as the machines communicating and the service they used, as shown on the right.
All of this has been incredibly useful. However, for the longest time I have been thinking about how to include time into link graphs. To date, I don’t really have a good solution. Here are some things I have considered:
- Animation: This is the most obvious solution. You use a tool that replays the data. Use fast forward to speed up the animation. Ideally the tool would allow for forwarding and reversing the animation, just like the controls you have to watch a movie. This approach has the disadvantage of change blindness. There are changes that the human brain will not notice. And the probably even bigger problem are the layout algorithms that are generally not built for incremental updates. Adding new nodes to a graph moves the existing ones around and the viewer cannot locate them anymore. [I wrote about this in my book in Chapter 3.] You can counter the problem of instability by assigning each node a pre-computed location. Use some hashing algorithm to do so.
- Color: The idea would be to assign color to nodes or edges. Use some sort of encoding to show time. For example, the lighter a color, the late it happened. This approach is very limited. There are only so many colors you have available. The human eye can only differentiate, really differentiate about 8 hues. Any more and it gets really hard to tell which node is brighter. [It might be more than 8, but the number is really really low]
- Using arrows that order the connections: This was an idea I had a while back. I don’t think it’s actually useful, but here it is anyways: You generate a link graph and then you introduce a set of arrows that connect the edges. The arrows indicate time, so you connect the earliest event with the second earliest , and so on. This will really clutter the display an is probably really hard to read.
- Paralll coordinates: Add a coordinate for time. This can help in some instances. In others the time-axis will just be completely cluttered. But worth a try.
- Multiple, linked views: The idea here is to generate your link graph and then in addition, you also generate a display that encodes time. For example, a time table. On the x-axis you show time and on the y-axis you show, the source node’s field. The problem here is how do you link the two displays. Interactivity is almost a must. So that you could click on a node and see it in the time chart. Even better would be if you could encode the relationships in the time table. However, that might be hard.
- Using a time-base layout algorithm: I am too bad of a coder to actually implement this idea. I am also not sure what the result would be like. The idea would be to define the attraction between nodes as the time distance. There are many problems. What do you do if a connection shows up at multiple instances in time? I haven’t thought this true. But maybe there is a possibility here.
Unfortunately, all of these solutions have drawbacks. I think I favor timecharts for showing time-based activity. But then, the number of entities you can track is limited, etc.
Anyone have a solution for showing time-based activity? Even if it’s animation, what are some of the key things that would help making the animation easy to follow?
[tags]visualization, link graph, network graph, time visualization[/tags]
November 30, 2008
I just came across this list of command to capture the state of a CISCO router. I wanted to capture this and maybe inspire someone to build an application for Splunk. It would be interesting to build a set of expect scripts that go out and capture this information in Splunk. You can then use the information for forensics, but also for change management. By building alerts you could even alert on unauthorized or potentially malicious changes. If you are interested in building an application, let me know. I’ be happy to help.
show clock detail
show version
show running-config
show startup-config
show reload
show users
show who
show log
show debug
show stack
show context
show tech-support
show processes
show processes cpu
show processes memory
content of bootflash
show ip route
show ip ospf
show ip ospf summary
show ip ospf neighbors
show ip bgp summary
show cdp neighbors
show ip arp
show interfaces
show ip interfaces
show tcp brief all
show ip sockets
show ip nat translations verbose
show ip cache flow
show ip cef
show snmp
show snmp user
show snmp group
show snmp sessions
show file descriptors
November 28, 2008